

Most traders describe position sizing with a percentage.
"I risk 1% per trade."
"I use 2% when conditions are good."
"I never risk more than 5%."
That sounds disciplined. It sounds mathematical. It sounds like risk management.
But a percentage by itself tells you almost nothing about the true risk architecture of a trading operation.
Position size is not simply a number attached to one trade. It is a force applied repeatedly to an uncertain sequence of outcomes. Every time that force is deployed, it reshapes the trader's future equity distribution.
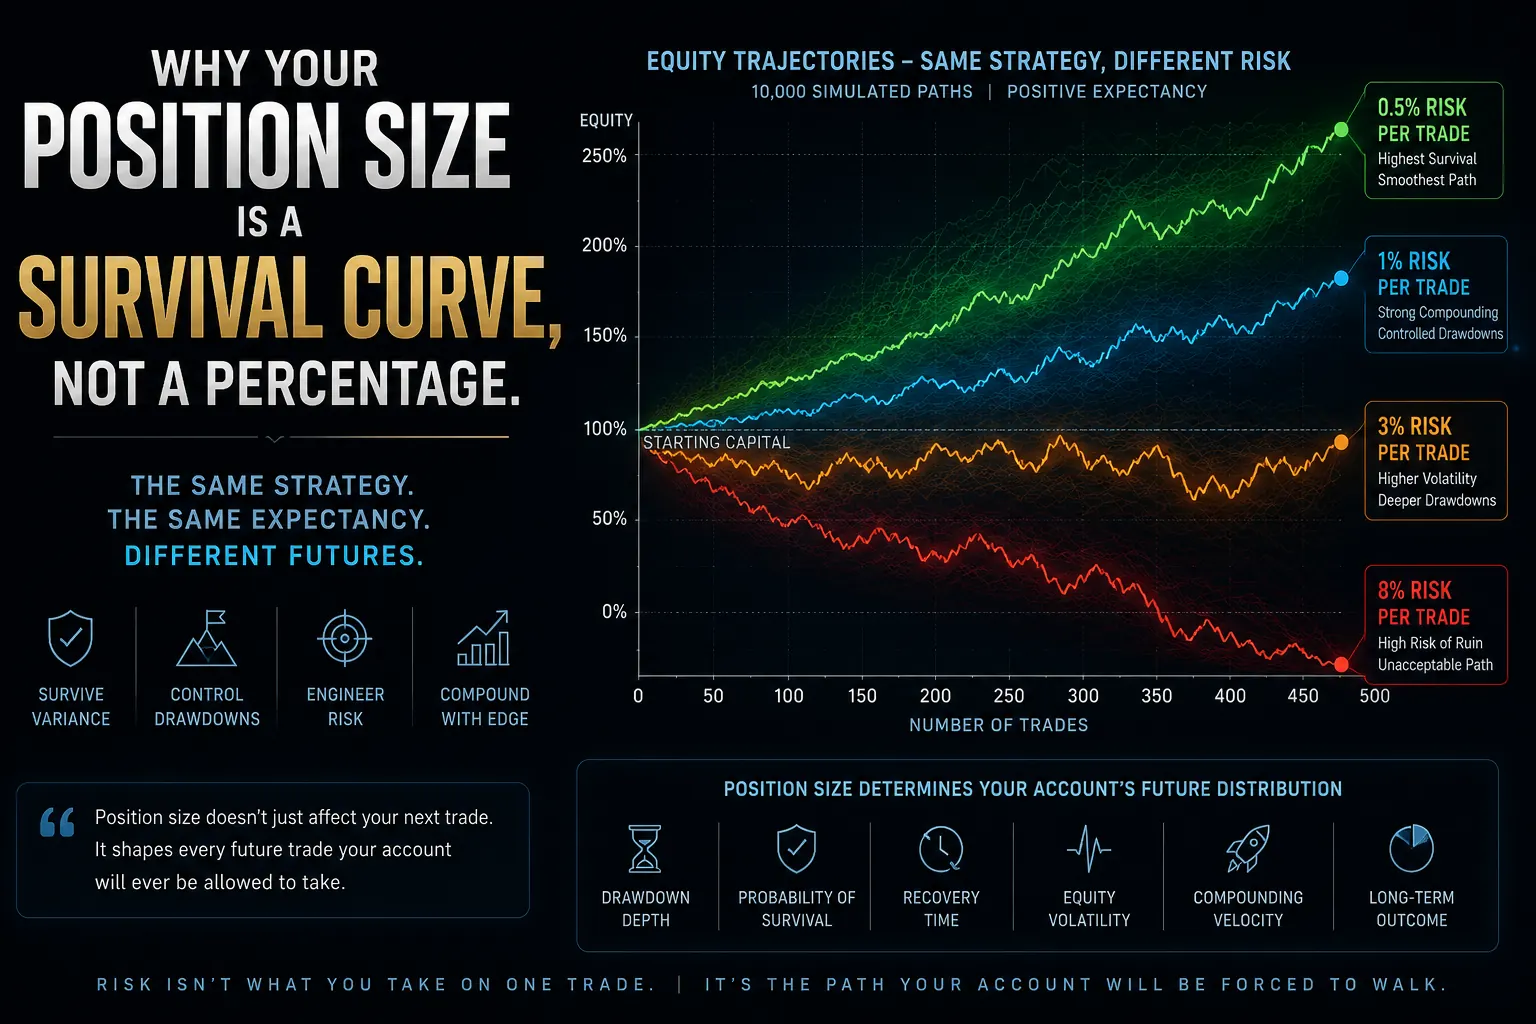
That is why your position size is better understood as a **survival curve**.
It determines:
- how quickly capital compounds,
- how violently equity fluctuates,
- how deep losing sequences can cut,
- how long recovery takes,
- how much statistical error the account can absorb,
- and whether the trader remains solvent long enough for expectancy to become visible.
The critical question is therefore not:
"What percentage should I risk?"
The better question is:
"What future distribution of survival, drawdown, recovery, and compounding does this risk level create?"
That is the foundation of professional risk engineering.
Position Size Is a Distribution Generator
Assume two traders execute the same strategy.
They take the same trades, in the same order, with the same win rate, payoff profile, fees, slippage, and expectancy.
Trader A risks 1% per trade.
Trader B risks 6% per trade.
The strategy has not changed. The entry logic has not changed. The expected value has not changed.
But the two traders are not operating the same system.
Their equity curves will have radically different:
- volatility,
- maximum drawdown,
- recovery burden,
- psychological pressure,
- compounding velocity,
- and probability of catastrophic failure.
Position size transforms the strategy's raw outcome distribution into an equity distribution.
The strategy produces R-multiples.
Risk sizing converts those R-multiples into capital consequences.
If a trade loses 1R:
- at 1% risk, the account loses approximately 1%;
- at 3% risk, it loses approximately 3%;
- at 6% risk, it loses approximately 6%;
- at 8% risk, it loses approximately 8%.
That appears obvious when viewed one trade at a time.
The deeper problem appears when outcomes are sequenced.
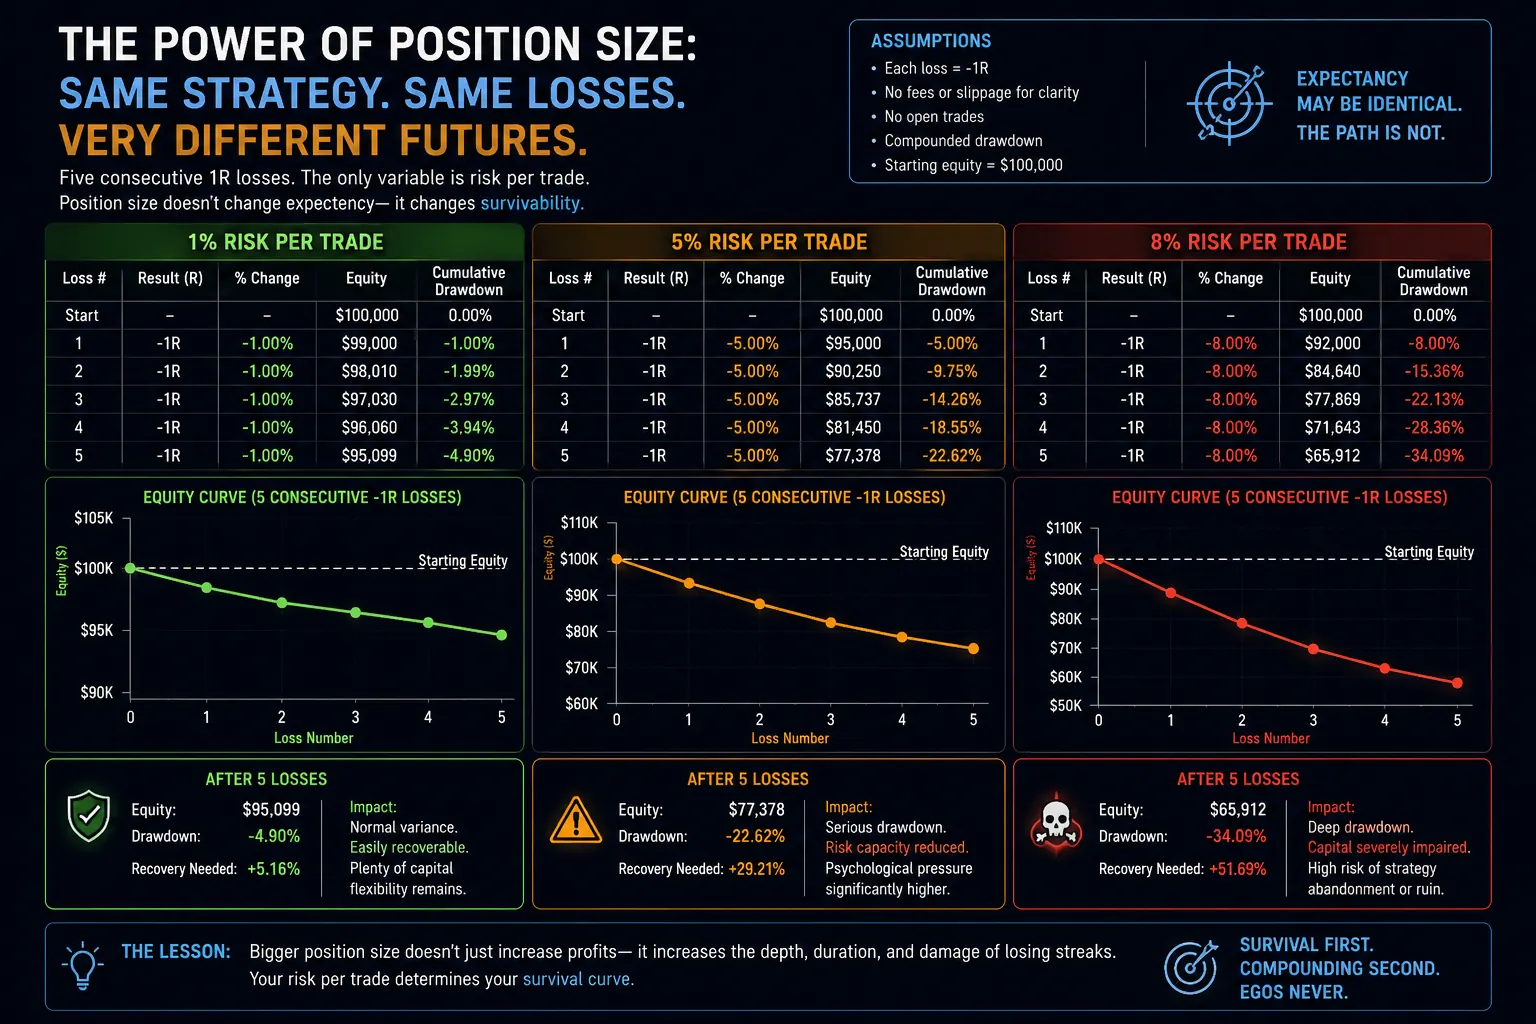
Five consecutive losses at 1% risk reduce capital by approximately 4.9%.
Five consecutive losses at 5% risk reduce capital by approximately 22.6%.
Five consecutive losses at 8% risk reduce capital by approximately 34.1%.
The strategy experienced the same five losses.
The risk engine created three entirely different realities.
One account experienced ordinary variance.
One entered a serious defensive state.
One moved dangerously close to structural impairment.
This is why professional position sizing cannot be separated from drawdown geometry.
The Percentage Is Only the First Input
A fixed-risk percentage appears simple because it compresses many assumptions into one number.
But the true risk of a position-sizing policy depends on a much larger system:
- win probability,
- payoff distribution,
- loss clustering,
- trade correlation,
- number of simultaneous positions,
- risk taken per cycle,
- branch or strategy mix,
- open exposure,
- slippage and fees,
- regime changes,
- drawdown thresholds,
- risk-reduction rules,
- and the trader's capacity to execute under pressure.
A trader who risks 2% across one isolated position is not necessarily taking less risk than a trader who risks 0.75% across four highly correlated positions.
The first trader has 2% exposed.
The second may have 3% nominal exposure, but potentially far more than 3% effective exposure if all four trades express the same macro bet.
Similarly, a trader who claims to risk 3% per trade may unknowingly expose 12% of equity during a four-position concurrent cycle.
The correct unit of analysis is therefore not always risk per trade.
Sometimes it is:
- risk per idea,
- risk per correlated cluster,
- risk per session,
- risk per cycle,
- risk per branch,
- or total authorized risk pool.
This is one of the central differences between casual position sizing and engineered capital deployment.
Expectancy Does Not Protect You From Variance
Many sophisticated traders understand expected value.
A simplified expectancy equation is:
EV = (Win Rate × Average Win) − (Loss Rate × Average Loss)
A system with positive expectancy should generate profit over a sufficiently large sample, provided its assumptions remain valid.
But positive expectancy does not guarantee a smooth path.
It does not guarantee that the next 10 trades will be profitable.
It does not prevent a losing streak.
It does not prevent drawdown clustering.
It does not prevent a profitable strategy from destroying an account when oversized.
A strategy can be statistically profitable and operationally unsurvivable.
That is one of the most important truths in trading.
Suppose a strategy has:
- 55% win rate,
- average winner of 1.2R,
- average loser of 1R.
Its theoretical expectancy is:
EV = (0.55 × 1.2R) − (0.45 × 1R)
EV = 0.66R − 0.45R = +0.21R
That is a meaningful edge.
But that edge is expressed as an average over a large number of trades. The actual sequence can still contain:
- five losses in a row,
- eight losses inside twelve trades,
- several breakeven outcomes,
- reduced winners,
- or a period in which market conditions temporarily suppress the strategy's payoff.
At 1% risk, the account can usually absorb those sequences without major structural damage.
At 8% risk, the same ordinary variance can create a crisis.
Expectancy tells you whether the game is worth playing.
Position sizing determines whether you survive long enough to play it.
Drawdown Is Not Linear
One of the most dangerous misconceptions in trading is treating losses and recovery as symmetrical.
They are not.
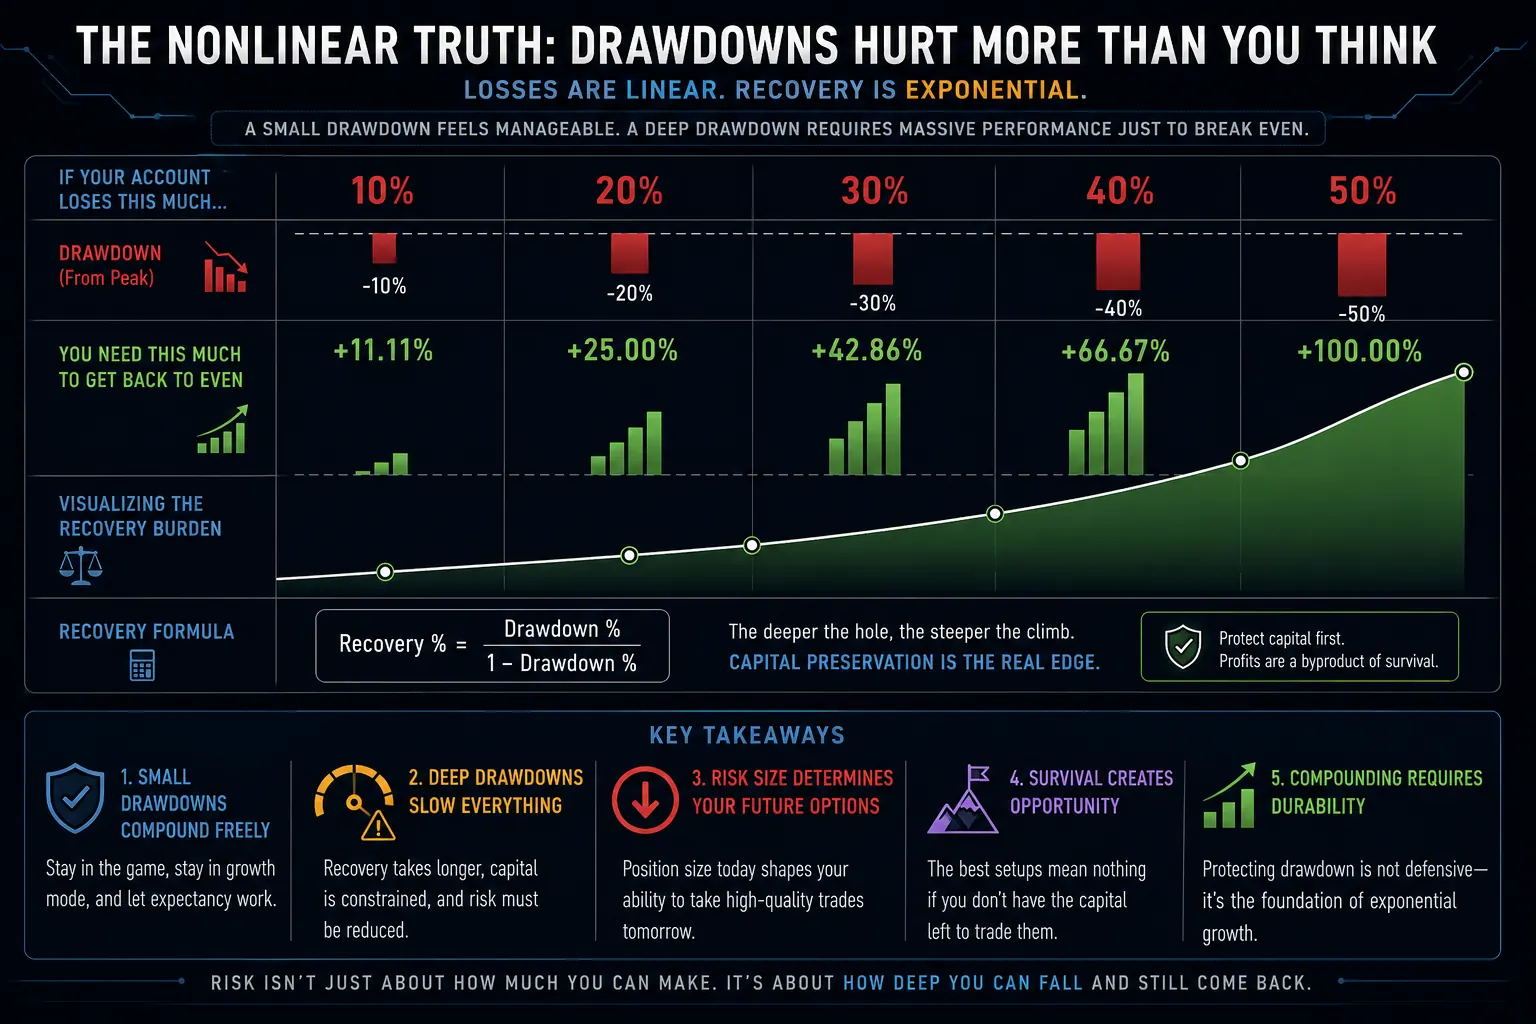
If an account loses 10%, it needs an 11.1% gain to recover.
If it loses 20%, it needs 25%.
If it loses 30%, it needs approximately 42.9%.
If it loses 40%, it needs approximately 66.7%.
If it loses 50%, it needs 100%.
The recovery requirement can be expressed as:
Recovery Required = Drawdown ÷ (1 − Drawdown)
where drawdown is written as a decimal.
For a 40% drawdown:
Recovery Required = 0.40 ÷ (1 − 0.40) = 0.6667
The account must earn 66.67% just to return to its previous peak.
This nonlinear recovery burden is why deep drawdown should not be viewed as merely "more of the same."
A 35% drawdown is not simply 5% worse than a 30% drawdown.
It creates:
- a larger mathematical recovery requirement,
- less remaining capital,
- reduced risk capacity,
- greater psychological pressure,
- more temptation to force trades,
- and higher sensitivity to subsequent losses.
Position size determines how quickly a routine variance event becomes a nonlinear recovery problem.
That is what makes it a survival variable rather than a mere percentage.
The Survival Curve
A survival curve describes the probability that an account remains operational over time under a given set of assumptions.
In trading, "survival" can be defined in different ways:
- avoiding total ruin,
- avoiding a maximum tolerable drawdown,
- avoiding a formal system-lock threshold,
- preserving enough capital to continue using the strategy,
- or remaining psychologically and operationally capable of following the plan.
For serious system design, ruin should not be defined only as reaching zero.
A trader can be functionally ruined long before the account reaches zero.
Examples include:
- a 40% drawdown that triggers a hard trading suspension,
- loss of the minimum capital required to size trades correctly,
- inability to withstand normal spread or margin requirements,
- abandonment of the system under emotional pressure,
- or a risk reduction so severe that recovery becomes impractically slow.
A useful risk model therefore asks:
What percentage of possible future paths remain above the account's operational failure boundary?
That question requires simulation or robust historical path analysis.
It cannot be answered by selecting a percentage because it "feels comfortable."
The MARS Monte Carlo framework, for example, is structured around 50,000 simulated paths, four concurrent trades per cycle, four cycles per week, drawdown-state gates, tier usage, lock probability, and survival-adjusted compounding. The objective is not merely to forecast profit. It is to establish the distribution of possible equity, drawdown, gate dwell, and survival outcomes.
That is risk engineering.
The Sequence Matters More Than the Average
Consider two sequences of ten trades.
Sequence A
W, L, W, L, W, L, W, L, W, L
Sequence B
L, L, L, L, L, W, W, W, W, W
Both sequences contain five wins and five losses.
If the payoff is identical, they may have the same final gross result before compounding differences.
But they do not create the same operational experience.
Sequence A produces alternating feedback and relatively controlled equity movement.
Sequence B creates a severe early drawdown before recovery begins.
With aggressive sizing, Sequence B may:
- force the account into a lower risk state,
- breach a maximum drawdown limit,
- trigger a system lock,
- reduce available margin,
- create execution hesitation,
- or cause the trader to abandon the strategy before the winners arrive.
This is known as path dependency.
The result depends not only on how many wins and losses occur, but on their order.
Position sizing magnifies path dependency.
The larger the risk applied to each outcome, the more important the order becomes.
This is why average win rate and average expectancy cannot fully describe survival.
The account does not experience averages.
It experiences sequences.
Concurrency Changes the Risk Geometry
Many retail traders calculate position risk individually but fail to calculate portfolio or cycle risk.
Suppose a trader opens four trades at 3% risk each.
Nominal total exposure is 12%.
If the trades are independent, the probability of all four losing may be relatively low.
But financial instruments are rarely perfectly independent.
Four trades may share exposure to:
- the U.S. dollar,
- risk-on or risk-off sentiment,
- interest-rate expectations,
- commodity prices,
- the same session breakout,
- or the same technical pattern.
A long EURUSD trade and a short USDCHF trade can effectively express a similar dollar view.
A long NASDAQ position and a long S&P 500 position may be two positions but one risk factor.
When trades are correlated, nominal diversification can become disguised concentration.
That means position sizing must account for:
\[ Effective Risk Individual Risk \]
unless correlations and interaction effects are understood.
A more realistic architecture asks:
- How much total risk is authorized for this cycle?
- How many active positions are already consuming that pool?
- Are the positions expressing the same underlying factor?
- How much fresh capacity remains?
- Should per-trade risk be compressed because open exposure is still active?
This is why MARS separates active open risk from realized evidence and subtracts existing exposure from the authorized cycle pool before determining fresh deployment. Closed trades are evidence; open trades are still consuming capital capacity.
That is more precise than blindly repeating the same percentage on every new trade.
Fixed Risk Is Better Than Emotional Risk—But It Is Not the Final Form
Fixed-percentage risk is a major improvement over arbitrary position sizing.
It prevents the trader from:
- doubling size after a loss,
- risking more because a setup "looks perfect,"
- shrinking irrationally after a normal losing streak,
- or changing exposure based on recent emotions.
For many traders, fixed risk is the correct starting point.
But fixed risk has a limitation.
It treats all capital states as equal.
A trader at a new equity high may use the same risk as a trader in a 28% drawdown.
A trader with strong positive expectancy may use the same risk as a trader whose live EV is deteriorating.
A trader with no open exposure may use the same risk as a trader already carrying three correlated positions.
A trader operating in stable variance may use the same risk as one experiencing structural instability.
That is not adaptive risk governance.
It is static risk repetition.
Professional systems often distinguish between:
- maximum authorized risk,
- current risk capacity,
- actual deployed risk,
- risk remaining,
- and risk temporarily suppressed.
The position size becomes conditional on system state.
Drawdown Gates: Converting Capital State Into Risk State
One way to engineer risk is through drawdown gates.
A gate is a predefined capital state determined by the account's drawdown from its most recent equity peak.
For example:
- Growth
- Recovery
- Buffer
- Floor
- Deep-Floor
- Ground-Floor
- System Lock
Each state represents a different level of capital authority.
As drawdown deepens:
- maximum tier may decline,
- cycle risk pool may contract,
- per-trade risk may be reduced,
- open exposure tolerance may shrink,
- and the system may eventually suspend trading.
The important principle is:
Capital state determines risk state.
This eliminates the common retail-trading behavior of using the same aggression level regardless of account condition.
The MARS architecture treats drawdown gates as a higher authority than daily P&L, setup confidence, or short-term expectancy. A favorable tactical signal cannot override a restricted capital state.
That hierarchy matters.
Without it, adaptive risk becomes discretionary permission to increase size.
With it, adaptation becomes governed contraction and expansion.
Position Size Should Contract Before the Trader Breaks
Most traders reduce risk too late.
They wait until:
- the drawdown feels unbearable,
- several large losses have already accumulated,
- the account is near a margin problem,
- or confidence has collapsed.
At that point, the trader is no longer making a calibrated risk decision.
The trader is reacting to pain.
A properly engineered system reduces risk before emotional and financial impairment become severe.
This is one reason capital states should be defined in advance.
For example:
- mild drawdown may produce modest compression,
- moderate drawdown may cap higher tiers,
- deep drawdown may force survival-level deployment,
- and extreme drawdown may activate a system lock.
The purpose is not to avoid every loss.
The purpose is to prevent ordinary variance from escalating into irreversible damage.
A good risk system does not ask the trader to become emotionally stronger than the mathematics.
It changes the mathematics before psychology fails.
Risk Efficiency Matters More Than Raw Return
A trader who earns 25% while risking 8% repeatedly may be less efficient than a trader who earns 15% with tightly controlled exposure.
Raw return does not reveal:
- how much capital was endangered,
- how deep the drawdown became,
- how much variance was tolerated,
- how often the system approached failure,
- or how much exposure was required to generate the profit.
This is why sophisticated risk frameworks evaluate metrics such as:
- return relative to risk deployed,
- profit factor adjusted for the risk environment,
- drawdown depth,
- recovery duration,
- risk-adjusted efficiency,
- equity acceleration,
- and survival-adjusted compounding.
The MARS Structural Diagnostic Engine is designed to analyze expectancy, drawdown, risk-adjusted efficiency, risk-adjusted profit quality, and equity acceleration as separate but connected dimensions. It recognizes that a system can be profitable while drawdown expands, or show strong profit factor while converting risk inefficiently.
A strong risk engine therefore asks:
How effectively is deployed risk being converted into durable capital growth?
Not merely:
How much money did the account make?
The Difference Between Risk Capacity and Risk Appetite
Risk appetite is how much risk the trader wants to take.
Risk capacity is how much risk the system can currently support.
These are not the same.
A trader may want to increase size because:
- the setup appears unusually clean,
- the account is behind schedule,
- the previous trade was a loss,
- a milestone is approaching,
- or a market opportunity feels rare.
None of those conditions automatically increase risk capacity.
Risk capacity should be determined by evidence such as:
- current drawdown state,
- current expectancy,
- open exposure,
- branch quality,
- recent variance,
- correlation,
- compliance,
- and benchmarked survival constraints.
Professional risk governance separates desire from authorization.
The trader may have the appetite to risk 6%.
The system may authorize only 3%.
The trader may want four fresh positions.
Existing open exposure may leave capacity for only two.
The trader may want to accelerate recovery.
The drawdown gate may require contraction.
That tension is not a system flaw.
It is the reason the system exists.
Why Small Accounts Create Dangerous Incentives
Small-account traders often reject conservative risk because the dollar returns appear insignificant.
At 1% risk on a \$1,000 account, one full loss is \$10.
At 1R profit, the gain is also roughly \$10.
The trader may conclude that meaningful growth requires 5%, 8%, or even 10% risk.
Mathematically, higher risk can accelerate compounding.
But it also steepens the survival curve.
This creates a difficult truth:
The risk level required to make a small account grow quickly may also create a high probability that the account will not survive.
There is no percentage that eliminates this tradeoff.
Aggressive compounding is not automatically irrational. But it must be treated as an explicit high-variance capital program rather than disguised as normal position sizing.
That requires:
- predefined drawdown gates,
- risk ceilings,
- cycle-level exposure control,
- Monte Carlo benchmarking,
- system-lock conditions,
- and acceptance that some paths will fail.
The trader must understand the distribution being purchased.
Faster upside is paid for with:
- greater drawdown,
- wider outcome dispersion,
- higher lock probability,
- and lower tolerance for execution error.
That is the honest mathematics.
Risk Engineering Is the Conversion Layer Between Edge and Alpha
A strategy's edge exists in probability.
Alpha exists in realized capital growth.
Between the two sits the risk engine.
A trader may possess a valid edge but fail to convert it because:
- risk is too large,
- risk is too small,
- exposure is mistimed,
- correlated positions are oversized,
- drawdown is not throttled,
- winners are clipped,
- losers cluster,
- or the trader abandons the process during variance.
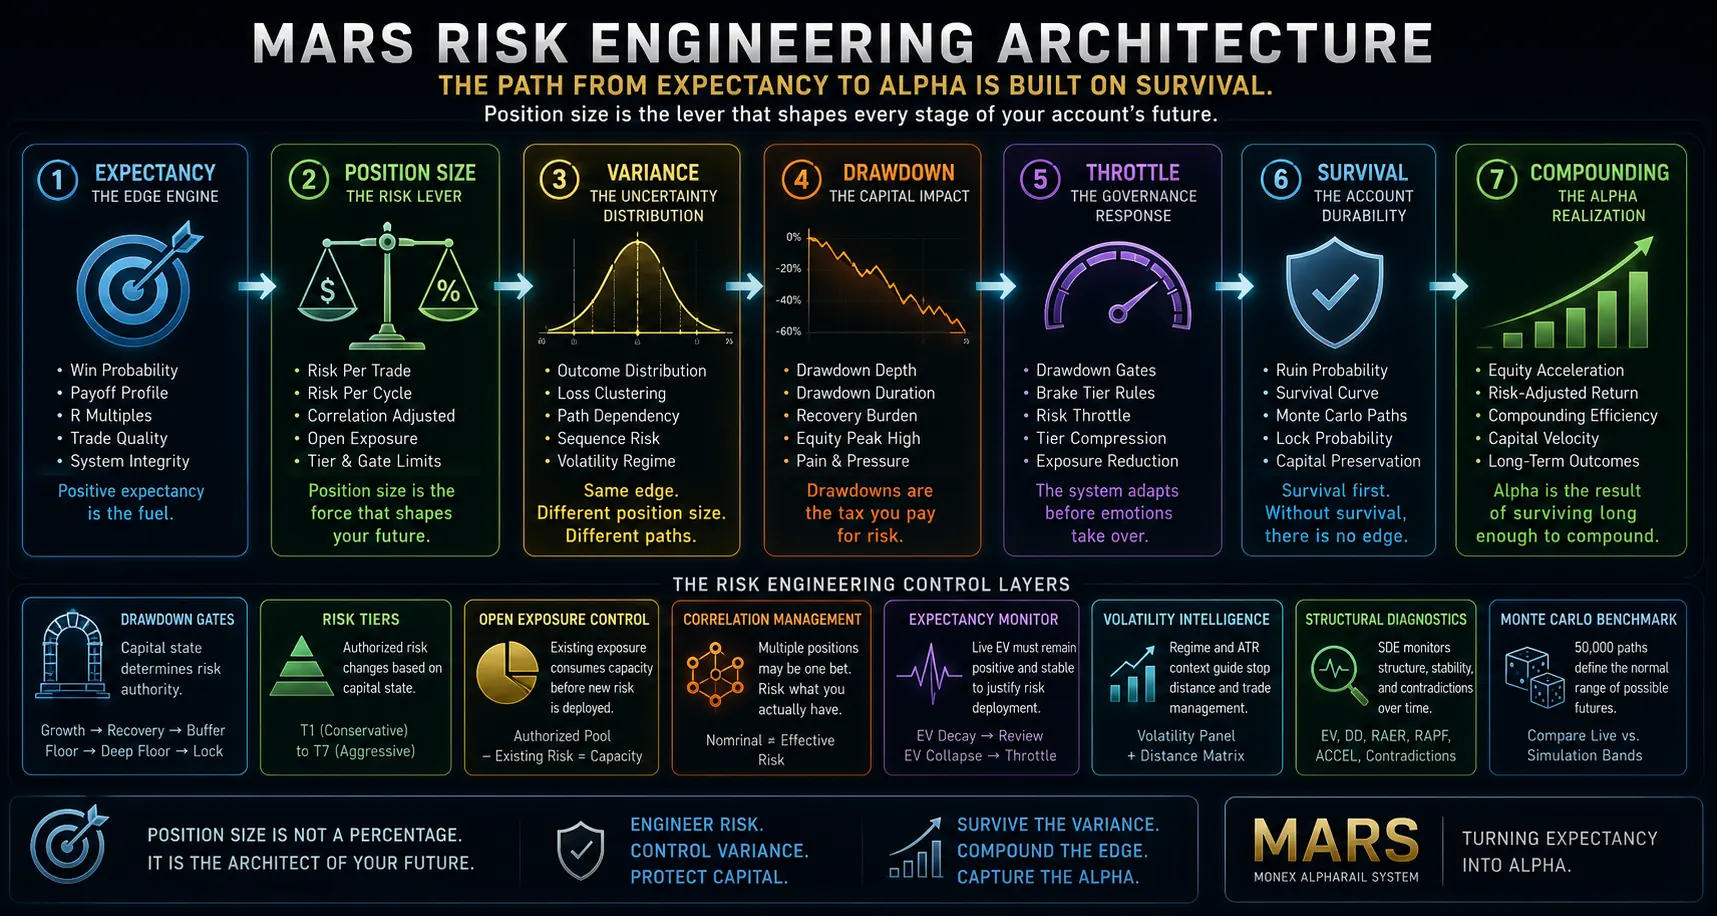
Risk engineering is the conversion layer that determines whether expectancy becomes durable performance.
The process can be viewed as:
\[ Edge Position Size Variance Drawdown Survival Compounding \]
Each stage affects the next.
Weak position sizing can destroy a strong edge.
Strong risk governance can preserve a modest edge long enough for compounding to work.
This is why MARS is designed as an authority system rather than a collection of isolated indicators or spreadsheets. Execution, journaling, weekly expectancy, drawdown gates, throttle control, open-exposure adjustment, volatility intelligence, structural diagnostics, and Monte Carlo benchmarking each address a different part of the conversion process.
What a Professional Position-Sizing Framework Should Answer
Before capital is deployed, a serious risk framework should be able to answer:
1. What is the maximum authorized loss on this trade?
Not what the trader hopes to lose.
Not what the stop "probably" limits.
The actual loss if the stop is reached, including realistic transaction costs.
2. What is the total exposure across all active trades?
Individual risk is incomplete without portfolio exposure.
3. How correlated are those positions?
Four symbols may still represent one macro thesis.
4. What drawdown state is the account currently in?
Risk authority should change when capital state changes.
5. How much risk capacity remains?
Existing open risk should reduce fresh deployment capacity.
6. Is the strategy still demonstrating positive live expectancy?
Historical backtests are not enough. Live evidence matters.
7. What is the expected drawdown distribution at this size?
This should be tested through Monte Carlo or robust resampling.
8. What is the probability of crossing the failure threshold?
The relevant threshold may be 20%, 30%, 40%, or another defined structural boundary.
9. How long will recovery likely take?
Drawdown depth and risk compression both affect recovery time.
10. What condition forces risk reduction or suspension?
The rule must exist before the drawdown begins.
If a trader cannot answer these questions, the trader does not yet have a position-sizing system.
The trader has a percentage.
The Percentage Is the Output, Not the Philosophy
The final position size may still be expressed as 1%, 3%, 5%, or another number.
But that number should be the output of a larger decision architecture.
It should reflect:
- the capital state,
- the strategy's measured edge,
- the authorized risk tier,
- the active exposure burden,
- the portfolio concentration,
- the volatility condition,
- the current drawdown,
- and the system's survival objective.
This distinction is critical.
An amateur starts with a percentage and looks for reasons to use it.
A risk engineer starts with the survival constraints and calculates what percentage the system can support.
Final Perspective: You Are Not Sizing a Trade
When you choose a position size, you are not only sizing the next trade.
You are sizing:
- the next losing streak,
- the next drawdown,
- the next recovery,
- the next period of execution uncertainty,
- the next cluster of correlated positions,
- and the probability that your capital survives long enough for the edge to express itself.
That is why position size is a survival curve.
Every percentage produces a different family of possible futures.
Some futures compound quickly.
Some move slowly but remain durable.
Some reach extraordinary returns.
Some terminate early.
The objective of risk engineering is not to eliminate uncertainty.
It is to decide, in advance, which uncertainty the trading system is authorized to carry.
A percentage tells you how much you may lose on one trade.
A survival curve tells you whether the entire trading operation is built to endure.
And endurance is where expectancy becomes alpha.
About the Montex AlphaRail System
The Montex AlphaRail System—MARS is a discretionary-quant trading framework designed to govern how expectancy is converted into controlled capital growth.
MARS combines:
- drawdown-based capital gates,
- dynamic risk tiers,
- cycle-level risk pools,
- open-exposure capacity controls,
- Monte Carlo benchmarking,
- expectancy monitoring,
- volatility intelligence,
- execution diagnostics,
- compliance scoring,
- and structural performance analysis.
The trader retains discretion at the execution layer, but capital deployment operates inside quantitative guardrails.
The objective is not merely to trade profitably.
It is to build a system capable of surviving variance, protecting capital, diagnosing deterioration, and converting repeatable expectancy into sustainable alpha.
Montex AlphaRail System
Turning Expectancy into Alpha.