

Analytics Labs
The ledger
is the story.
Profit is only the headline. The labs interrogate every number beneath it — expectancy by branch, the path between entry and exit, which variant actually earned — and grade the week before you trust it.
Layer 01 — The ledger
Raw trades in. Governed performance truth out.
Compliance Panel 3 is the flagship operating ledger. It converts raw trade records into governed performance truth — journal evidence, weekly rollups, gate state, the EV scorecard, branch risk and compounding dynamics. Execution evidence is logged; the Journal and Weekly Summary compress it into weekly probabilities and branch counts; the Scorecard turns those into branch EV, blended EV and a week status.
Layer 02 — Expectancy, interrogated
A blended number can hide a weak branch.
The Advanced EV Analytics Lab decomposes expectancy — by branch, rolling, blended, standard against variant — and stress-tests it for sensitivity and outliers, so the operator sees where edge actually comes from. It is a sandbox with a door: experiments are validated against evidence before deliberate promotion, and never contaminate the live Scorecard until tested and approved.
How MARS uses this
Every workbook in MARS belongs to one of three layers. The evidence core records and grades what actually happened; the deployment rail converts capital state into governed risk; context and validation engines judge whether the environment and the structure can be trusted. Data crosses layers on defined rails - never informally.
How it benefits you
Eleven workbooks stay one coherent machine instead of a folder of spreadsheets. You always know which layer a number came from and which layer it is allowed to influence - so evidence informs, authority governs, and experiments never contaminate live rules.
The three-layer module ecosystem: evidence flows up from the core, authority flows down the deployment rail, context validates from above.
Layer 03 — The trade path
What happened between entry and exit is the story.
The MAE/MFE Execution Efficiency Lab reads the path itself: maximum adverse and favourable excursion, capture, giveback, fee drag and net outcome. Profit with poor capture, high giveback and heavy fees is not high-quality alpha — this lab is where that gets exposed, branch by branch.
Layer 04 — The week and the variant
Is the system still worth deploying — and which management earned?
The Weekly Trading Scorecard grades every week GREEN, YELLOW or RED, replacing “did I make money?” with “is the system still worth deploying?” — and leans on the rolling window, because one week is noise. Variant attribution compares Standard, Conservative and Aggressive management inside each branch; the seven-lens matrix decides which variant is even permitted, and the gate always wins.
Reference
The five labs — the question each one answers
| Lab | Reads | The question |
|---|---|---|
| Compliance Panel 3 | Journal evidence, weekly rollups, gate state, EV scorecard | What actually happened, in governed form? |
| Advanced EV Analytics Lab | EV by branch · rolling · blended · outlier-robust | Does the EV number deserve the trust? |
| MAE/MFE Execution Efficiency Lab | Adverse and favourable excursion, capture, giveback, fees | Was the result clean, or did the path leak it? |
| Weekly Trading Scorecard | Branch EV, blended EV, quotas, the rolling window | Is the system still worth deploying? |
| Variant Attribution Module | Standard vs conservative vs aggressive, checkpoint hits | Which management actually earned — and is it permitted? |
The governing idea
Worked example
Branch-level EV decomposition with blend weights. The blended number alone would hide exactly this picture.
Go deeper
Operator briefs on this territory.
Deep dive — 01
Statistical truth first: the gate battery every EV must pass.
Sample gate, lower bound, P(EV>0), outlier stripping — the honesty battery before any EV means anything.
Read the full brief →
Deep dive — 02
MAE/MFE: what your trades did while you weren't looking.
Reading maximum adverse and favorable excursion to audit stops, targets, and exits with evidence.
Read the full brief →
Deep dive — 03
Green, yellow, red — and why the color never acts alone.
The color is a headline, not an order. Status × stability is the actual operating read.
Read the full brief →
Where this connects
Every room in MARS answers to the others.
Nothing here works alone. Step through the next door and watch the same trade from a different seat.

The Platform
Eleven workbooks. One authority.
See how every trade is routed through one stack that nothing lower can override.
Step inside →

Risk Systems
The vault has seven locks.
Find out which ones your drawdown has already closed — and what that allows.
Step inside →

Volatility
Same market. Different weather.
Why a stop that is safe in Asia is reckless in a New York news window.
Step inside →

Simulation
Your equity curve is one draw.
Read a losing month as variance or as a warning — against thousands of futures.
Step inside →

Metrics & Diagnostics
Five gauges. One hierarchy.
Read the machine in order of authority — EV first, and nothing below overrides it.
Step inside →

Diagnostics Engines
X-ray the machine.
Seven engines read what the P&L hides — before it becomes a large problem.
Step inside →

Proprietary Indicators
Three tools. One rail.
Regime, confluence and continuation — on the chart, feeding the journal.
Step inside →

Pricing
Four ways onto the rail.
Each tier answers a different question. Find the one you are asking right now.
Step inside →
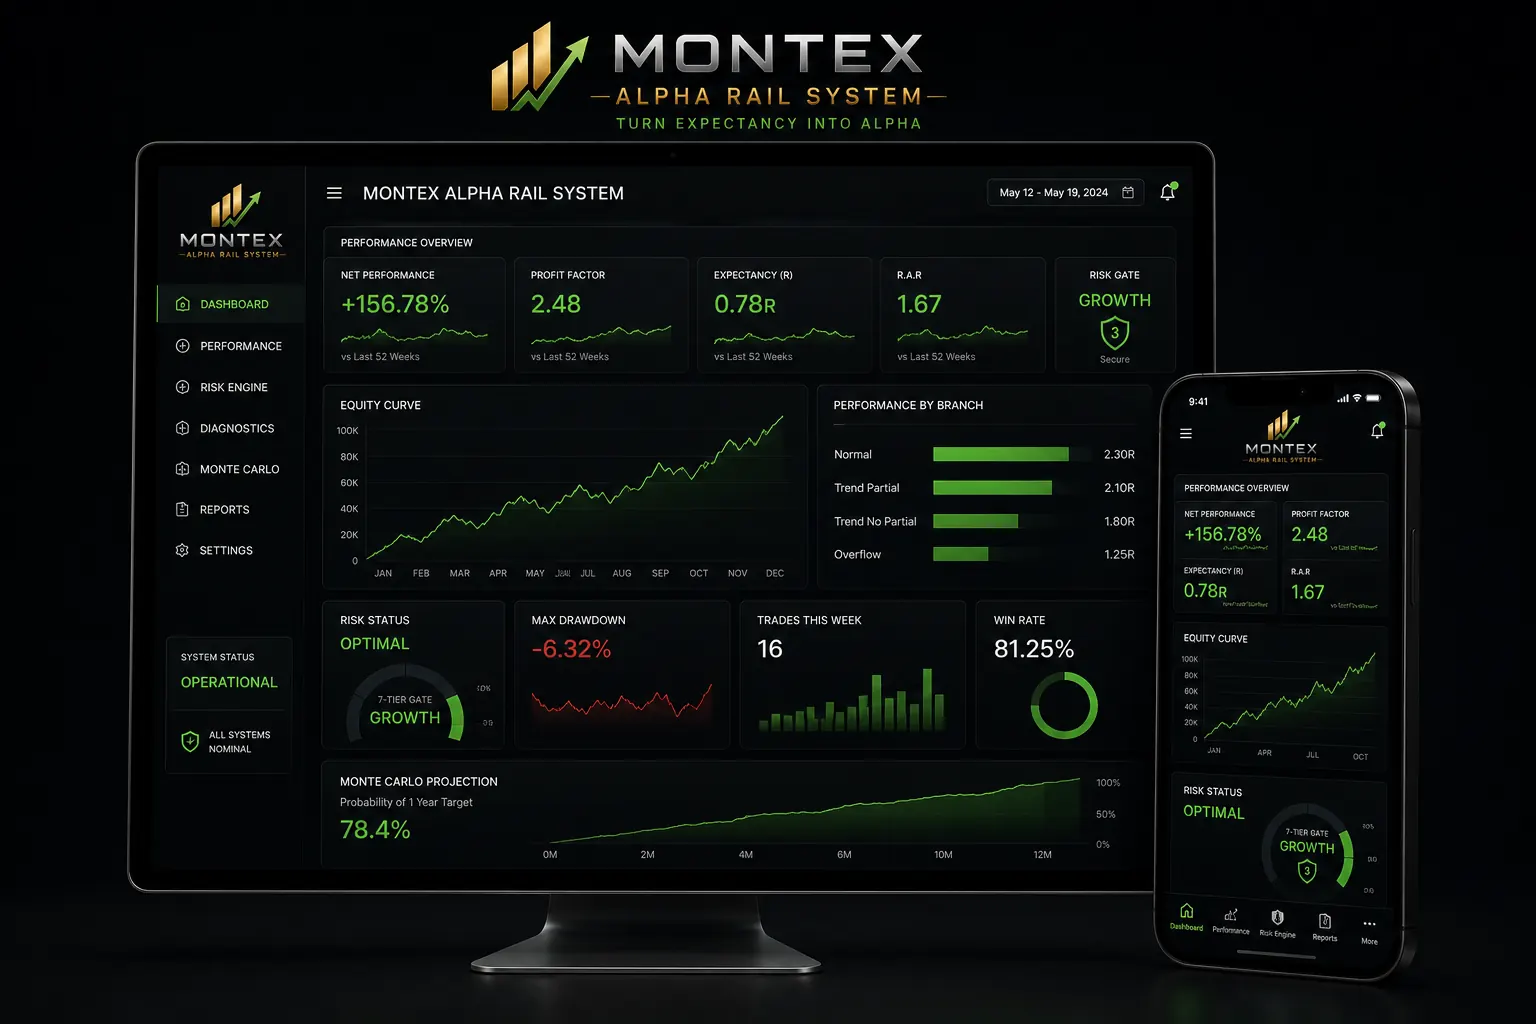
Every module ships in the complete MARS package.
One price. Eleven workbooks, three TradingView indicators, and the full manual library — $497.