

Executive thesis. Performance drift is the progressive separation between the behavior a trading process is expected to produce and the behavior it is actually producing. In forex, the first visible symptom is often not a catastrophic drawdown. It is usually a quieter change in the joint distribution of expectancy, hit rate, payoff, excursion, execution cost, trade duration, and regime exposure. The advanced trader’s job is therefore not to ask, “Is the strategy winning?” but “Is the strategy still behaving like the strategy I authorized?”
The Dangerous Version of Drift Is the One That Still Looks Profitable
A trading system can deteriorate while its cumulative P&L remains positive. That is what makes performance drift operationally dangerous. A few large winners can conceal a falling win rate. A favorable volatility burst can disguise deteriorating entry quality. Higher leverage can preserve nominal returns while risk-adjusted efficiency collapses. A tighter spread environment can temporarily subsidize a strategy whose underlying signal quality has weakened.
This is especially relevant in foreign exchange because the market is not a single centralized venue with one observable order book. Spot and most FX derivatives trade over the counter across a fragmented execution ecosystem. The BIS reported average OTC FX turnover of roughly $9.6 trillion per day in April 2025, with activity occurring across instruments, counterparties, venues, and internal dealer pools. A strategy therefore interacts not only with price behavior but with a changing execution environment. The same entry logic can experience materially different slippage, fill quality, liquidity, and market impact across time.
For an advanced trader, drift should be treated as a monitoring problem before it becomes a P&L problem. The objective is not to eliminate variance. That is impossible. The objective is to distinguish normal variance from a persistent change in the process that generates returns.
A Practical Definition: Performance Drift Is Distributional, Not Emotional
The simplest definition is useful: performance drift occurs when the live distribution of strategy outcomes moves away from its validated reference distribution. The word distribution matters. A strategy is not defined by one number. It is defined by a family of behaviors: trade frequency, win probability, average win, average loss, tail outcomes, maximum adverse excursion, maximum favorable excursion, holding time, transaction cost, correlation with other positions, and sensitivity to market state.
A trader who watches only cumulative return is monitoring the last layer of the system. By the time the equity curve clearly breaks, several upstream variables may have been deteriorating for weeks or months. A better framework treats P&L as the output of a chain:
- Opportunity set — how often valid conditions occur.
- Signal quality — how frequently the entry thesis produces favorable movement.
- Payoff realization — how much of that movement the exit logic captures.
- Execution quality — how much spread, slippage, rejection, latency, and financing subtract from gross edge.
- Risk translation — how efficiently position sizing converts edge into account-level return.
- Portfolio interaction — whether correlated positions amplify or diversify the underlying bet.
Drift can originate in any link. This is why “my win rate fell” is not yet a diagnosis. It is only a symptom.
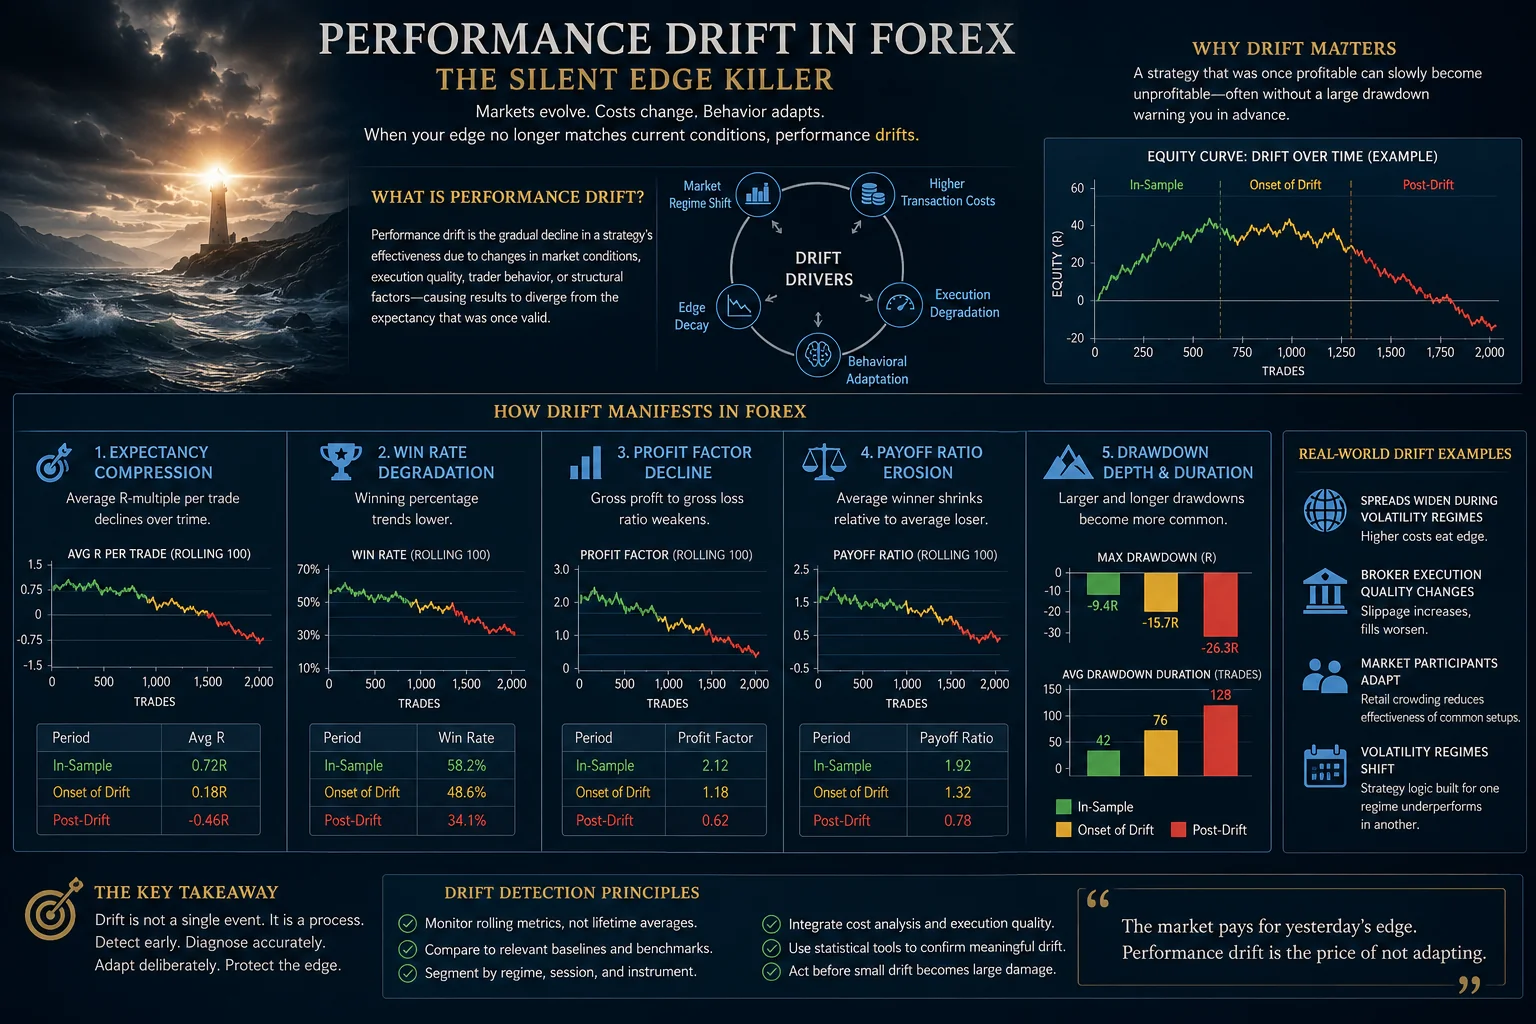
Five Drift Mechanisms That Matter in Forex
Edge Decay: The Conditional Advantage Has Weakened
Edge decay is the most direct form of drift. A setup that once produced favorable conditional expectancy may become less informative because market participants adapt, liquidity migrates, structural relationships change, or the original pattern was weaker than the backtest implied. This is the failure traders fear most, but it should not be assumed first. The research problem is difficult because backtests are vulnerable to selection bias and overfitting. Bailey and co-authors show that investment strategies selected from repeated historical trials can look compelling in-sample yet degrade out-of-sample. The implication is severe: some apparent “drift” is not a once-good edge dying; it is the discovery process finally revealing that the edge was overstated.
That distinction changes the response. True edge decay suggests a previously robust relationship has weakened. Backtest overfitting suggests the original benchmark was too optimistic. Both reduce live performance, but only one is evidence that the market changed.
Regime Mismatch: The Strategy Is Intact, but Its Habitat Changed
A trend-following process can look broken inside compression. A mean-reversion model can look brilliant until a persistent directional regime arrives. An intraday breakout model can deteriorate when realized volatility contracts, then recover when volatility expands. In these cases the strategy may not have decayed at all; the frequency of favorable market states has changed.
Forex is particularly exposed to this because monetary policy divergence, inflation surprises, geopolitical shocks, risk sentiment, funding conditions, and session liquidity can reshape volatility and directional persistence. The April 2025 BIS survey itself was conducted during elevated FX volatility following major trade-policy announcements, an example of how macro shocks can alter the environment in which execution and strategy performance are observed.
A robust drift process therefore conditions performance on regime. If aggregate expectancy falls, ask whether conditional expectancy fell inside the same regime or whether the regime mix changed. Those are different problems.
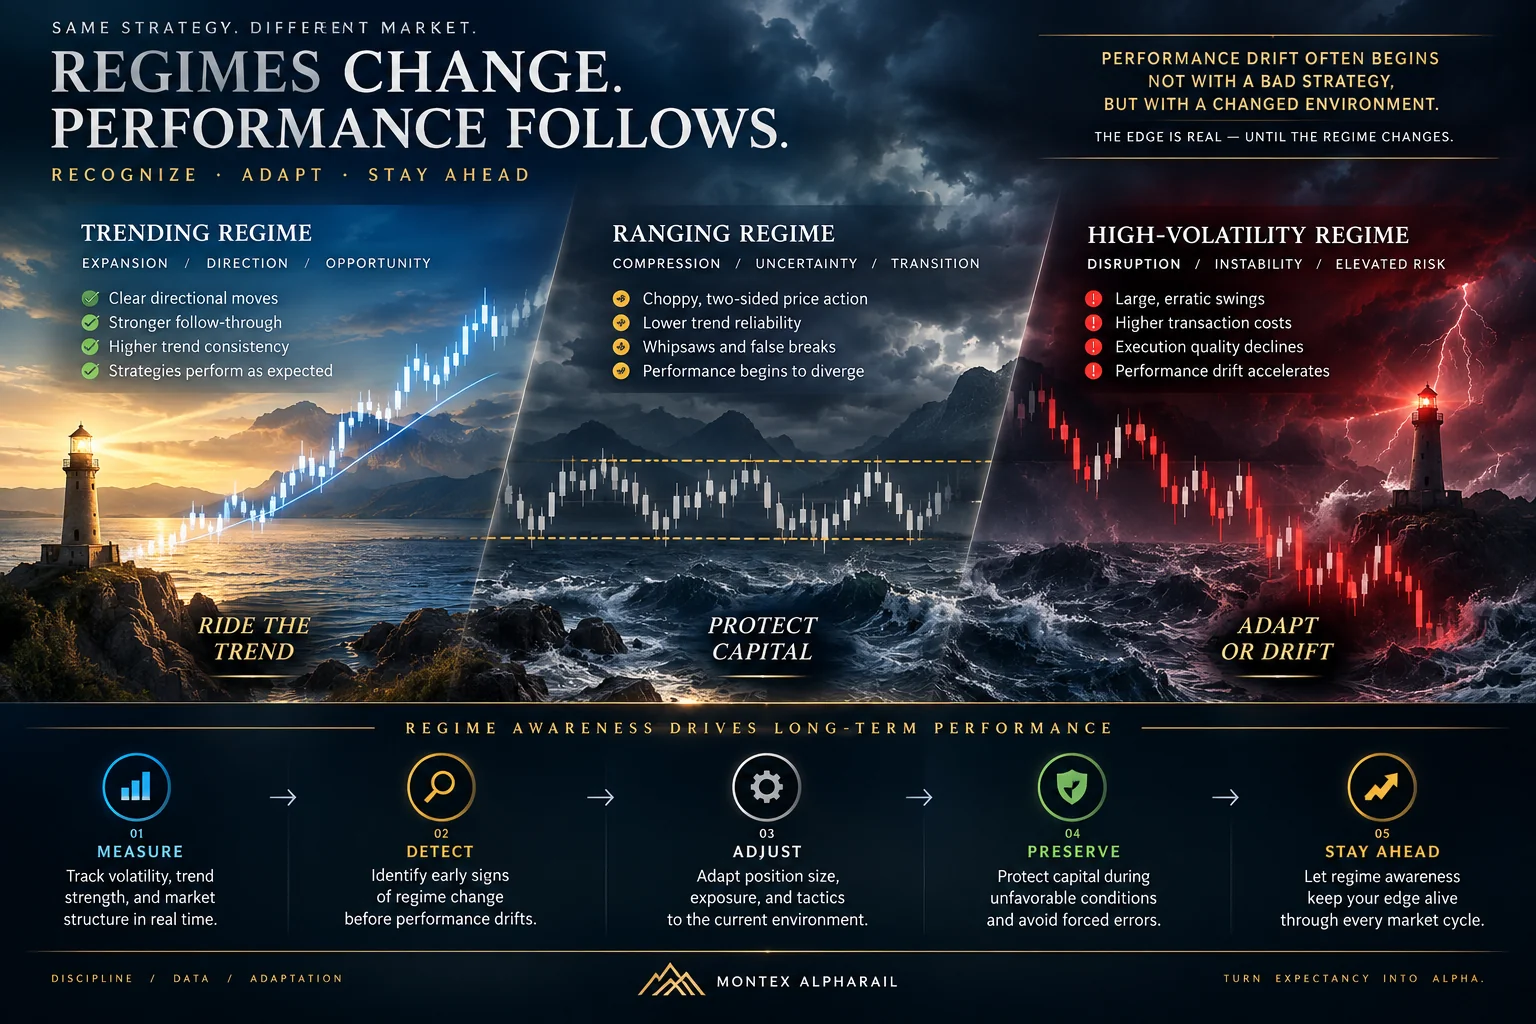
Execution Drift: The Gross Edge Survives, the Realized Edge Leaks
Execution drift is frequently underdiagnosed in retail and systematic FX. The BIS notes that electronification and execution algorithms have improved matching efficiency but also transfer more execution risk to users and operate inside a fragmented market structure. The Global Foreign Exchange Committee has likewise promoted transaction-cost-analysis data templates so users can evaluate execution quality.
For a trader, the relevant question is not whether spreads “look normal.” The question is whether the distribution of realized implementation costs has shifted relative to the strategy’s expected gross edge. A two-tenths-of-an-R deterioration in average implementation cost can be negligible for a 5R trend system and fatal for a high-turnover system whose pre-cost expectancy is only a few tenths of R.
Execution drift can appear as widening effective spread, increased slippage, lower fill ratios, higher rejection rates, longer latency, more stop overshoot, worse rollover, or a growing difference between theoretical and realized entry price. If these variables deteriorate while pre-cost signal quality remains stable, changing the strategy logic may be exactly the wrong intervention.
Behavioral Drift: The Trader Became a Different Execution Engine
Discretionary systems introduce another source of nonstationarity: the operator. Entry selectivity may loosen after a winning streak. Stops may widen during drawdown. Valid trades may be skipped after several losses. Targets may be cut early when confidence drops. None of those changes require the market to change; the live strategy has changed because its implementation changed.
This is why advanced performance analytics should split “strategy performance” from “operator adherence.” If adherence falls while market-conditioned opportunity quality remains stable, the system should not be re-optimized around behavior that violated its own rules. Otherwise the research process rewards implementation error by encoding it into the next version.
Portfolio Drift: The Trades Are the Same, but the Aggregate Bet Is Not
FX positions are relational instruments. Long EUR/USD and long GBP/USD can become a concentrated short-dollar expression. Long AUD/JPY and NZD/JPY can become overlapping risk-sentiment exposure. A strategy may therefore preserve per-trade expectancy while portfolio-level drawdown worsens because correlation, concentration, or concurrent exposure has changed.
Portfolio drift matters because “four valid trades” is not necessarily four independent risks. If correlations rise during stress, a historically diversified set of positions can behave like a single macro position precisely when losses cluster. Monitoring should include gross and net currency exposure, pair correlation, concurrent risk, and marginal contribution to drawdown—not only per-trade statistics.
The Central Diagnostic Problem: Variance or Structural Deterioration?
Every strategy experiences bad samples. Drift monitoring becomes dangerous when normal randomness is interpreted as structural failure, because the trader begins changing rules in response to noise. The opposite error is equally costly: dismissing a persistent shift as “just variance” until losses become undeniable.
The solution is not a magic threshold. It is a layered evidence standard. Small changes should require persistence, cross-metric agreement, or statistical evidence before they trigger structural intervention. NIST’s guidance on exponentially weighted moving-average control charts is useful conceptually: EWMA methods give more weight to recent data and are better than basic control charts at detecting small, persistent shifts in a process mean. A trading implementation can borrow that logic without pretending financial returns are a factory process.
In practice, the strongest evidence of drift is rarely “profit factor fell below X.” It is a constellation: rolling expectancy weakens, MAE worsens, MFE capture falls, variance expands, trade duration changes, execution costs rise, and the same pattern persists across multiple windows or comparable regimes.
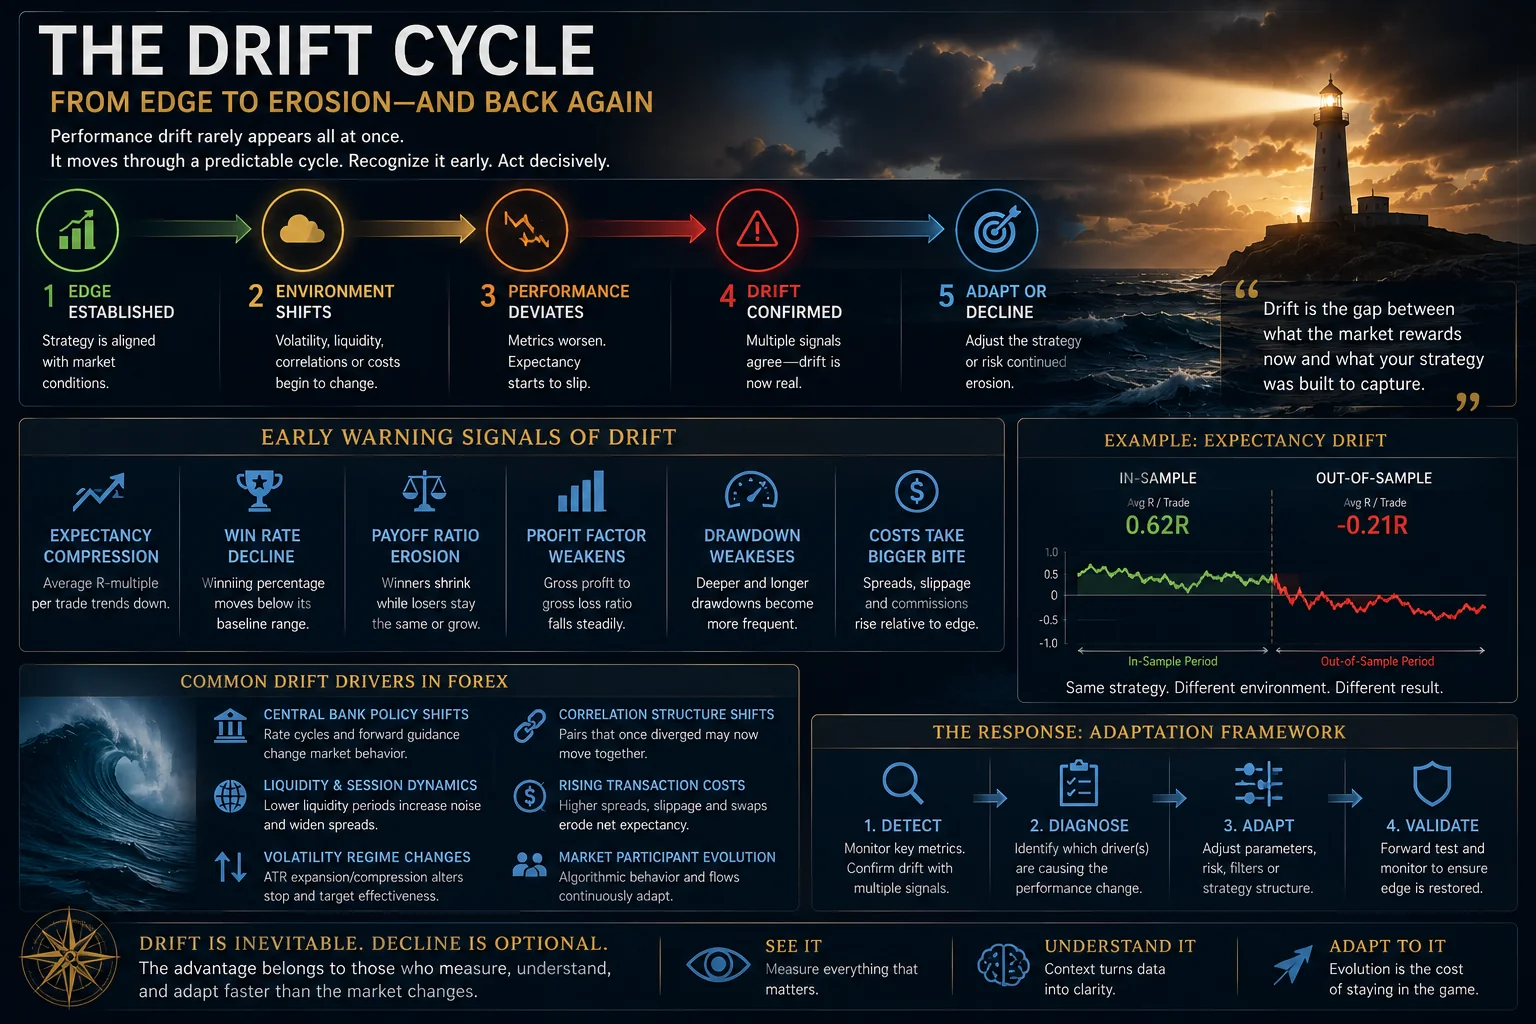
A Drift Dashboard Should Monitor Layers, Not Trophies
| Layer | Core metrics | What drift can mean | First question |
|---|---|---|---|
| Return | Expectancy, profit factor, Sharpe/Sortino, drawdown | Outcome distribution weakening | Is the deterioration persistent and risk-adjusted? |
| Payoff | Avg win/loss, tail share, runner conversion, skew | Exit logic capturing less favorable movement | Did MFE stay stable while realized payoff fell? |
| Excursion | MAE, MFE, adverse/favorable path | Entry timing or market path changed | Are trades going further against us before working? |
| Execution | Effective spread, slippage, rejection, stop overshoot | Implementation cost increased | Is gross edge stable before costs? |
| Regime | Volatility, trend persistence, session, macro state | Opportunity mix changed | Did conditional performance fail inside the same regime? |
| Process | Rule adherence, skipped trades, overrides | Operator altered the live system | Are we measuring the intended strategy? |
| Portfolio | Correlation, currency concentration, concurrent heat | Independent trades became one macro bet | Did aggregate exposure change? |
The purpose of this dashboard is not to generate more numbers. It is to identify where the causal chain first diverges. A system with flat expectancy and worsening execution needs a different response from a system with stable execution and collapsing MFE. A system with weak aggregate results but normal regime-conditioned results may simply be spending more time outside its favorable state.
Rolling Windows: Useful, Necessary, and Easy to Misuse
Rolling metrics are the natural instrument for drift detection because they show whether recent behavior differs from the longer reference period. But a single rolling window can create false certainty. A 20-trade window is responsive but noisy. A 100-trade window is stable but slow. The advanced solution is to use nested horizons.
For example, maintain a fast window for detection, a medium window for confirmation, and a long window for structural context. The exact lengths depend on trade frequency, but the logic is general:
- Fast window — detects sudden changes in expectancy, excursion, and execution.
- Medium window — tests whether the shift persists beyond a short cluster.
- Long window — anchors the current state to a broader validated distribution.
- Cumulative reference — provides historical context but should never be allowed to dilute recent deterioration.
The important comparison is not simply fast versus long. Compare standardized deviations. A 0.15R expectancy drop may be enormous for a low-variance process and irrelevant for a highly dispersed one. Z-scores, percentile ranks, confidence intervals, or Bayesian posterior estimates can convert raw changes into scale-aware evidence.
Also resist overlapping-window theater. If a 20-trade, 25-trade, and 30-trade window all flash red, they are not three independent confirmations. They are mostly the same data viewed through slightly different lenses. Confirmation should come from different information: another horizon, another metric family, another regime slice, or another instrument group.
Expectancy Decomposition: Diagnose the Equation Before Replacing the Strategy
At the trade level, expectancy can be written in R-multiple terms as:
Expectancy. E[R] = P(win) × AvgWin[R] − P(loss) × AvgLoss[R] − AvgCost[R]
That equation is basic. The diagnostic use is not. A falling expectancy should be decomposed into its moving parts. If win probability falls but average win expands, the system may simply be expressing a more trend-dependent payoff profile. If average win collapses while MFE remains unchanged, exit capture may be deteriorating. If both gross win/loss behavior and MFE remain stable while net expectancy falls, costs are the likely culprit.
The strongest drift reviews go one step further and condition each term: by pair, session, volatility bucket, direction, holding-time bucket, setup family, and market regime. Aggregate stability can hide a decaying subgroup, while aggregate deterioration can hide a stable core surrounded by a changing opportunity mix.
Do Not Let Sharpe Ratio Become a False Alarm — or False Reassurance
Risk-adjusted metrics are valuable, but they are not self-interpreting. A Sharpe ratio can deteriorate because mean return fell, volatility rose, serial dependence changed, or the sample is simply short. Strategy selection can also inflate apparent Sharpe performance when many variants were tested and only the winner was retained. Bailey and López de Prado’s Deflated Sharpe Ratio framework was designed to correct performance claims for selection bias and non-normal returns.
For live drift monitoring, the lesson is broader than any one statistic: never compare a live metric with an in-sample benchmark as if that benchmark were perfectly known. The more alternatives, parameters, filters, and branches you tested before choosing the live system, the more conservative your baseline should be.
A system that backtested at Sharpe 2.1 after hundreds of trials should not be labeled “degraded” simply because live Sharpe is 1.2. The correct question is whether 1.2 is inconsistent with a selection-adjusted, out-of-sample expectation. Without that correction, the drift detector may be diagnosing the research process rather than the market.
Structural Drift Versus Execution Drift: The Most Valuable Split in FX Analytics
For forex specifically, separate theoretical trade performance from implementation performance whenever data permits. Maintain a “decision price” or reference price at signal time, the actual fill, the effective spread, post-fill markouts, stop execution, and financing. This allows the trader to estimate a gross signal curve and a net realized curve.
The Global FX Code and its supporting TCA work reflect the professional importance of execution transparency and measurable transaction quality. This is not institutional bureaucracy; it addresses a real analytical problem. A strategy cannot be governed intelligently when the operator cannot distinguish a weaker signal from a more expensive route to market.
A useful hierarchy is:
- Gross alpha stable + net alpha weak → investigate execution, costs, and implementation.
- Gross alpha weak + execution stable → investigate signal quality, regime, and edge decay.
- Gross alpha weak only in certain regimes → investigate conditioning, not universal shutdown.
- Gross and net alpha stable + drawdown worse → investigate sizing, concentration, and sequence risk.
- All metrics unstable after a rule/process change → investigate implementation drift and version control first.
A Professional Escalation Model: Observe, Investigate, Throttle, Suspend, Research
Drift monitoring becomes governance only when the metrics are tied to pre-defined actions. Otherwise a dashboard simply produces anxiety. A strong escalation model can use five states:
| State | Evidence standard | Action |
|---|---|---|
| Observe | One weak metric or one short-window deviation. | No strategy change. Increase scrutiny and verify data quality. |
| Investigate | Persistent deviation or cross-metric confirmation. | Segment by regime, pair, execution venue, time of day, and rule adherence. |
| Throttle | Evidence of deterioration is meaningful but not conclusive. | Reduce risk authority or exposure while collecting additional data. |
| Suspend | Live behavior breaches a structural tolerance or operational control. | Stop new risk in the affected strategy or component. |
| Research | A credible deterioration hypothesis requires testing. | Move the problem into a separate research environment without contaminating production rules. |
The throttle state is especially valuable. Traders often think in binary terms: either the strategy is trusted or it is broken. Risk can be treated as an information-sensitive control variable instead. When evidence quality declines, capital authority can contract before the research team has enough evidence to justify a permanent model change.

What Not to Do When Performance Drifts
Do Not Optimize the Last Losing Sample
Re-optimizing parameters immediately after a weak period is one of the fastest ways to convert variance into overfitting. The recent sample is precisely the data generating the emotional pressure to change the system. If it becomes the optimization target, the research process becomes path-dependent and reactive.
Do Not Use Cumulative Statistics to Overrule Recent Evidence
A strategy can have excellent lifetime profit factor and still be deteriorating now. Long samples stabilize estimates but can also bury local failure. Cumulative metrics belong in the reference layer, not the alarm layer.
Do Not Treat Every Pair as One Homogeneous Market
EUR/USD, GBP/JPY, AUD/USD, and USD/MXN differ in liquidity, session behavior, macro sensitivity, spread, and volatility. Aggregate FX statistics can hide pair-specific deterioration. Segment before generalizing.
Do Not Confuse Lower Opportunity Frequency With Weaker Edge
A strategy may take fewer trades because its conditions occur less often. That is not necessarily performance decay. Opportunity scarcity should be separated from conditional trade quality.
Do Not Hide Costs Inside “Strategy Variance”
Spread, commissions, slippage, swap, and stop execution are not random bookkeeping details. They are part of realized expectancy. The CFTC explicitly warns retail forex traders that fees, spreads, financing charges, and other expenses materially affect results. A production analytics system should therefore measure them as a dedicated performance layer.
A 12-Question Performance-Drift Review for Advanced FX Traders
- Has rolling expectancy moved outside its historical or validated range?
- Is the change driven by win probability, payoff ratio, loss size, costs, or trade frequency?
- Did MAE increase, suggesting entries are experiencing more adverse path before resolution?
- Did MFE remain stable while realized R fell, suggesting weaker exit capture?
- Has the distribution of slippage, spread, stop overshoot, or financing changed?
- Is the deterioration present after conditioning on volatility and market regime?
- Is it concentrated in specific pairs, sessions, directions, or setup families?
- Has trade duration shifted materially?
- Has concurrent currency exposure or correlation increased?
- Has rule adherence, discretionary override frequency, or skipped-trade behavior changed?
- Was the original performance benchmark adjusted for multiple testing and out-of-sample uncertainty?
- What pre-defined governance action is authorized by the current evidence: observe, investigate, throttle, suspend, or research?
The Deeper Insight: Drift Is an Information Problem, Not a Confidence Problem
The mature response to deteriorating performance is not “believe in the system” and it is not “trust your gut and change it.” Both responses are epistemically weak. The correct response is to increase the resolution of the evidence.
A good drift framework makes confidence conditional. If recent performance weakens but excursion, cost, and regime-conditioned expectancy remain within tolerance, confidence in the underlying edge may remain high even while P&L is poor. If several independent diagnostic families deteriorate together, confidence should fall even before a large drawdown appears.
This is the real value of performance analytics: it moves system governance upstream. Instead of waiting for losses to become emotionally undeniable, the trader watches the architecture of the return process itself.
Final Perspective: The Equity Curve Should Be the Last Alarm, Not the First
The forex market evolves through technology, liquidity migration, policy shocks, changing participant behavior, and shifting volatility. The BIS describes a market that is increasingly electronic, fragmented, and complex. In that environment, assuming a strategy’s historical distribution will remain stationary is not a serious operating model.
But constant adaptation is not the answer either. A system that changes every time recent results disappoint has no stable identity and no valid benchmark. The goal is controlled adaptation: define the expected behavior, monitor multiple layers, detect persistent deviations, identify the source, reduce risk authority when evidence weakens, and reserve rule changes for a separate research process.
Performance drift is therefore not merely a metric. It is a governance discipline. The advanced trader is not trying to predict exactly when an edge will fail. The objective is to build a measurement system capable of recognizing when the strategy has stopped behaving like the strategy that was originally validated—early enough that capital decisions can change before the equity curve forces them to.
Key Takeaways
- Performance drift is a persistent change in the distribution of strategy behavior, not simply a losing streak.
- In FX, separate edge drift, regime drift, execution drift, behavioral drift, and portfolio drift before changing rules.
- Use nested rolling windows and scale-aware deviations rather than one arbitrary threshold.
- Decompose expectancy into win probability, payoff, loss size, and implementation cost.
- Condition results by regime, pair, session, direction, and setup family to avoid misleading aggregates.
- Treat execution quality as its own diagnostic layer; gross edge and net edge can diverge.
- Link drift evidence to governance actions such as observe, investigate, throttle, suspend, and research.
- Keep production and research separate so a bad recent sample does not become the next overfit model.
Sources and Further Reading
The article synthesizes the following research and industry sources. Accessed August 29, 2026.
- Bank for International Settlements. OTC Foreign Exchange Turnover in April 2025 — Triennial Central Bank Survey
- Bank for International Settlements. Triennial Central Bank Survey of Foreign Exchange and OTC Derivatives Markets in 2025
- Chaboud, Alain; Rime, Dagfinn; Sushko, Vladyslav. The Foreign Exchange Market — BIS Working Papers No. 1094
- BIS Markets Committee. FX Execution Algorithms and Market Functioning — Markets Committee Papers No. 13
- Global Foreign Exchange Committee. FX Global Code
- Global Foreign Exchange Committee. Algo/TCA Templates — Transaction Cost Analysis Data Standards
- Bailey, David H.; Borwein, Jonathan; López de Prado, Marcos; Zhu, Qiji Jim. The Probability of Backtest Overfitting
- Bailey, David H.; López de Prado, Marcos. The Deflated Sharpe Ratio: Correcting for Selection Bias, Backtest Overfitting and Non-Normality
- NIST/SEMATECH. EWMA Control Chart — Engineering Statistics Handbook
- U.S. Commodity Futures Trading Commission. Eight Things You Should Know Before Trading Forex
Editorial note. The equity curves, rolling metric panels and in-sample versus out-of-sample comparisons in Figures 1 and 3 use synthetic data created solely to explain analytical concepts. They are not backtested or live performance results for Montex AlphaRail Systems and should not be interpreted as return claims.
Disclaimer. This article is educational and analytical, not individualized financial advice. Performance statistics describe uncertain distributions; they do not guarantee future outcomes. Forex trading involves substantial risk, including the risk of loss amplified by leverage.