

Most trading journals tell you where a trade ended.
They record the entry, exit, profit, loss, and perhaps the final R-multiple. A winning trade appears as a positive number. A losing trade appears as a negative number. The result is categorized, added to the performance record, and treated as complete.
But the final outcome is only the last frame of the trade.
It does not tell you:
- how close the position came to failure,
- how much open profit existed before the exit,
- whether the entry was precise or badly timed,
- whether the market offered more opportunity than you captured,
- or whether the trade succeeded despite weak execution.
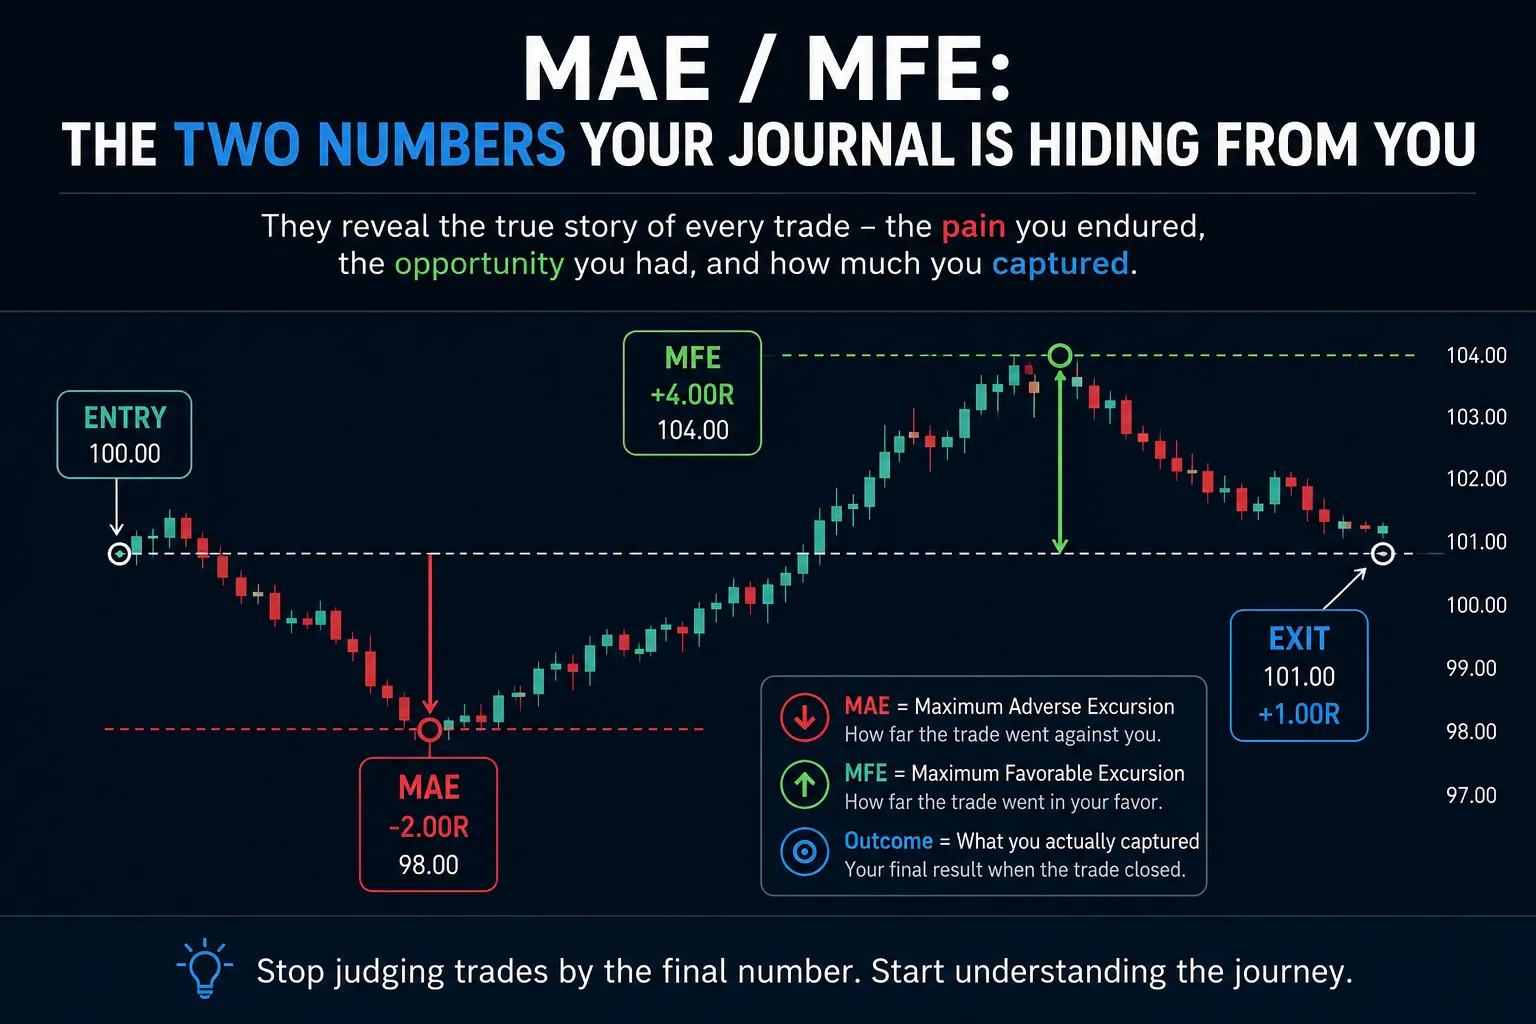
That missing information lives inside two measurements: Maximum Adverse Excursion and Maximum Favorable Excursion.
MAE and MFE reveal what happened between entry and exit. Together, they transform a list of trading outcomes into a map of execution behavior.
They do not merely tell you whether a trade won.
They help explain how the result was produced.
The Problem With Outcome-Only Journaling
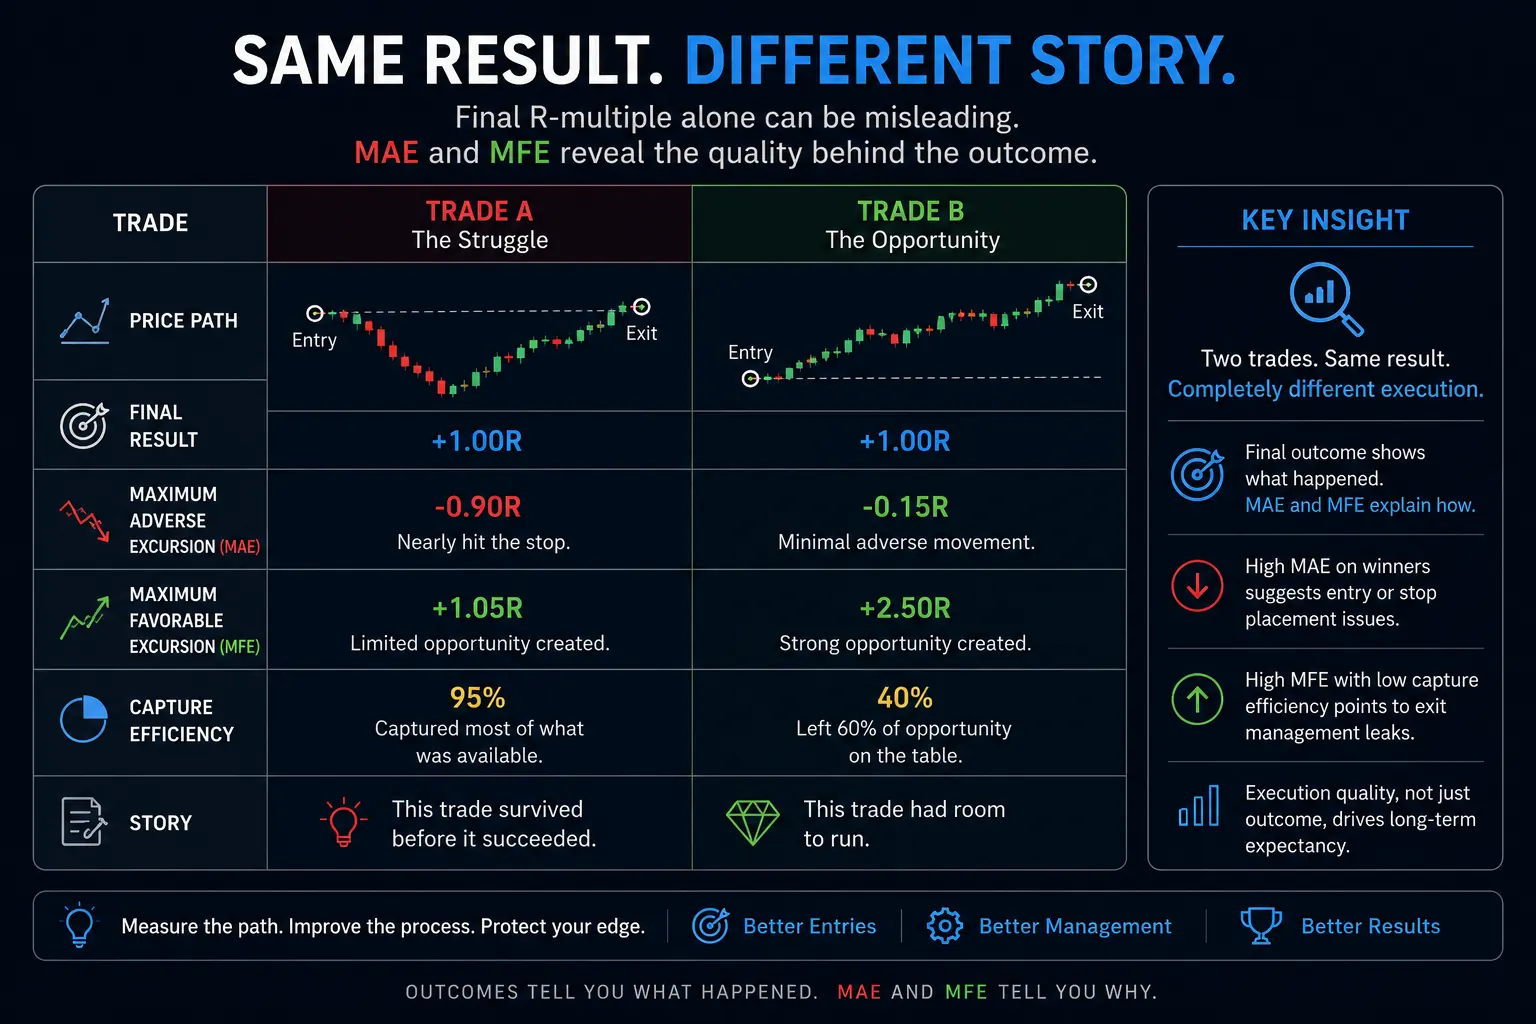
Imagine two trades that both finish at +1R.
On a conventional journal, they look identical.
Both are winners. Both contribute the same amount to total R. Both improve the win rate and profitability statistics by the same amount.
But now consider their internal paths.
Trade A
- The trade moved almost the full stop distance against the position.
- It then reversed and barely reached the final target.
- It never generated materially more opportunity than the realized result.
Trade B
- The trade moved very little against the entry.
- It accelerated quickly in the intended direction.
- It produced significantly more unrealized profit than was eventually captured.
The recorded outcome is the same.
The execution story is not.
Trade A may indicate a poorly timed entry that happened to survive.
Trade B may indicate a high-quality entry combined with an inefficient exit.
Without excursion data, both trades are flattened into the same statistic.
That is the weakness of outcome-only analysis.
It measures the destination while ignoring the path.
What Is Maximum Adverse Excursion?
Maximum Adverse Excursion, or MAE, measures the furthest a trade moved against the position while it was open.
For a long trade, MAE is the largest downward movement from the entry before the position closed.
For a short trade, it is the largest upward movement against the entry.
When expressed in R, MAE becomes comparable across instruments, account sizes, and stop distances.
An MAE of 0.20R means the trade used only a small portion of the original risk before moving favorably.
An MAE of 0.85R means the trade nearly reached the failure boundary before recovering.
MAE can help reveal:
- entry precision,
- timing quality,
- stop-location quality,
- volatility mismatch,
- excessive chasing,
- and how much pressure successful trades typically require.
Low MAE is not automatically good, and high MAE is not automatically bad. Some strategies naturally tolerate more adverse movement than others.
The value comes from comparing the measurement with the intended behavior of the setup.
What Is Maximum Favorable Excursion?
Maximum Favorable Excursion, or MFE, measures the greatest unrealized profit a trade reached while it remained open.
For a long trade, MFE is the highest favorable movement above the entry.
For a short trade, it is the greatest favorable movement below the entry.
MFE shows how much opportunity the market offered after the trade was entered.
A trade that closes at +0.50R may have reached only +0.60R at its best.
Another trade with the same final result may have reached +3R before reversing.
Those trades should not be interpreted the same way.
The first may have been managed efficiently inside a weak opportunity.
The second may represent substantial profit giveback.
MFE can help diagnose:
- opportunity quality,
- market regime strength,
- target realism,
- exit efficiency,
- trend participation,
- and whether a strategy is reaching the payoff profile it was designed to capture.
MAE Measures Pressure; MFE Measures Opportunity
A useful way to think about the relationship is:
MAE measures the pressure absorbed. MFE measures the opportunity created.
The final result sits between them.
That gives the trader three distinct dimensions:
- Adverse path — How much pain did the trade absorb?
- Favorable path — How much opportunity did the market provide?
- Realized result — How much of that opportunity became actual performance?
A final result without these dimensions is incomplete.
A trader may be profitable while entering poorly.
Another may enter well but monetize badly.
Another may execute perfectly in a market that simply did not provide enough movement.
MAE and MFE help separate those conditions.
Execution Attribution: Explaining the Result
Attribution is the process of identifying where performance came from.
In trading, the final outcome may be influenced by several layers:
- setup selection,
- entry location,
- volatility,
- timing,
- stop placement,
- trade management,
- market regime,
- and exit behavior.
When a strategy underperforms, the trader needs to know which layer is responsible.
Was the idea wrong?
Was the idea correct but the entry late?
Did the market move favorably but the exit give back too much?
Did the trade never create enough opportunity to justify the target?
Was the stop too tight for the volatility environment?
Was a trend-style exit used in a market that did not support continuation?
These are attribution questions.
MAE and MFE do not provide every answer by themselves, but they greatly narrow the diagnosis.
They move the review from:
“This trade lost.”
to:
“This trade experienced limited adverse pressure, reached meaningful favorable excursion, and then failed to convert that opportunity.”
That is a much more useful statement.
Four Trade-Life-Cycle Profiles
One of the clearest ways to interpret MAE and MFE is to group trades by their pressure-and-opportunity profile.
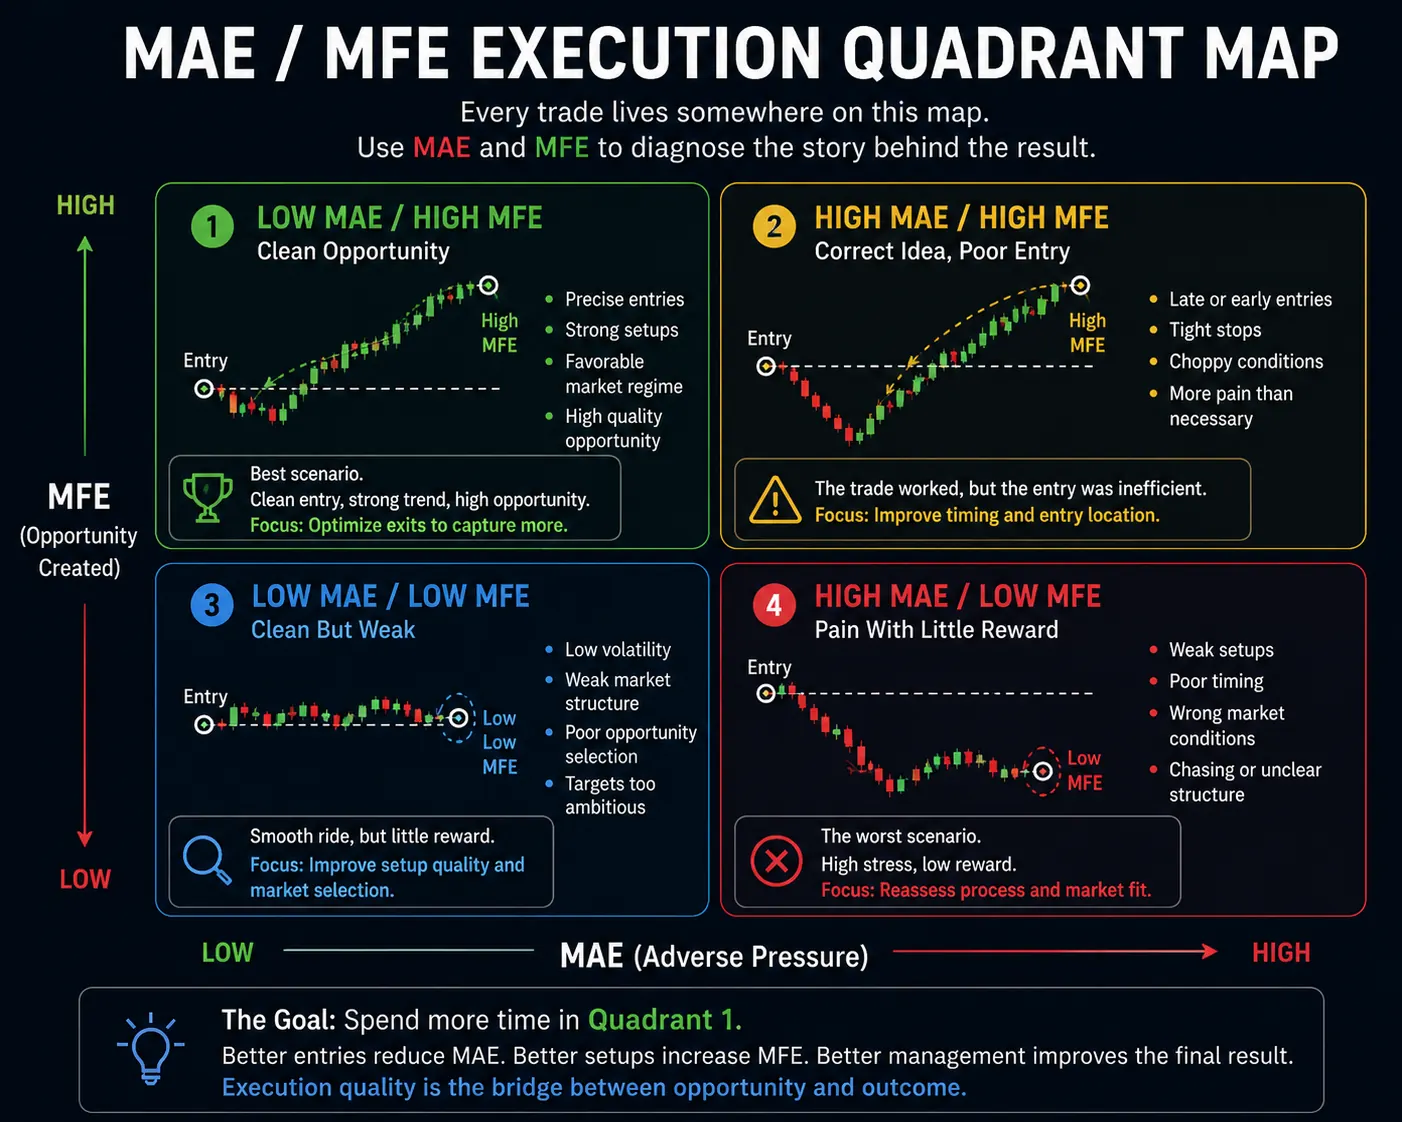
1. Low MAE, High MFE
This is the ideal shape.
The trade experienced little adverse movement and generated significant favorable movement.
It may indicate:
- strong entry location,
- good timing,
- favorable market structure,
- and strong regime alignment.
These trades deserve close study because they often contain the clearest expression of the strategy's edge.
The key question becomes:
Was the available opportunity converted efficiently?
A clean entry does not guarantee a strong final result.
2. High MAE, High MFE
These trades eventually produced meaningful opportunity, but only after absorbing significant pressure.
That can suggest:
- the trade idea was valid,
- the entry timing was weak,
- the position entered too early,
- or the stop architecture did not match the market's volatility.
This profile is important because it separates directional correctness from execution quality.
The strategy may not need to be replaced.
The entry process may need refinement.
3. Low MAE, Low MFE
These trades are clean but unproductive.
They do not experience much adverse movement, but they also fail to create substantial favorable movement.
Possible explanations include:
- low-volatility conditions,
- weak setup selection,
- poor session timing,
- limited expansion,
- or unrealistic profit objectives.
A trade can be comfortable without being valuable.
Low pain is not the same as high quality.
4. High MAE, Low MFE
This is the most problematic profile.
The trade absorbs substantial pressure while generating little opportunity.
A repeated concentration in this category may indicate:
- weak setup selection,
- poor timing,
- chasing,
- incorrect market classification,
- unsuitable instruments or sessions,
- or a mismatch between entry logic and volatility.
These trades create the worst combination: high stress and low payoff potential.
The Difference Between a Bad Trade and a Bad Result
One of the greatest advantages of excursion analysis is that it helps distinguish process from outcome.
A losing trade can be well executed.
A profitable trade can be poorly executed.
Suppose a trade follows the plan, enters at a strong location, experiences limited adverse movement, and creates reasonable favorable excursion—but then fails due to normal variance.
That may be a good trade with a bad result.
Now consider a profitable trade entered late, nearly stopped out, managed inconsistently, and rescued by an unexpected market reversal.
That may be a bad trade with a good result.
Outcome-only journaling rewards the second trade and punishes the first.
Execution attribution corrects that distortion.
This matters because long-term improvement depends on reinforcing good decisions, not merely rewarding profitable accidents.
What MAE Can Reveal About Entry Quality
A trader may possess a reliable directional edge while still entering inefficiently.
For example, winning trades may repeatedly travel deeply against the position before moving favorably.
That can indicate:
- entering before confirmation,
- chasing after expansion,
- entering inside noise rather than at structure,
- using stops inconsistent with volatility,
- or selecting poor trade locations.
The result may still be profitable, but the execution creates unnecessary variance.
This has several consequences:
- more trades approach the stop,
- emotional pressure increases,
- position management becomes harder,
- and the strategy becomes less scalable.
A clean strategy with poor entries can appear unstable.
MAE helps reveal whether the instability comes from the underlying idea or from execution timing.
What MFE Can Reveal About Opportunity Quality
MFE answers a different question:
Did the market actually offer enough movement after entry?
If MFE is consistently low, the problem may not be the exit.
The market may simply not be producing sufficient opportunity.
Possible causes include:
- weak volatility,
- poor instrument selection,
- trading outside favorable sessions,
- unrealistic targets,
- or attempting trend-style management in a non-trending environment.
This distinction is critical.
A trader should not blame profit-taking rules when the market never created much profit to take.
Conversely, consistently high MFE combined with weak final results points toward a monetization problem rather than an opportunity problem.
The Hidden Cost of Profit Giveback
One of the most valuable uses of MFE is measuring the difference between peak opportunity and realized outcome.
Suppose a trade reaches +3R but closes at +0.75R.
The trader still records a profit.
The journal still shows a winner.
But the trade gave back 2.25R of favorable movement.
That does not automatically make the management wrong.
Trend-following systems often accept substantial giveback because protecting every small fluctuation would destroy their ability to capture large moves.
The real question is whether the giveback is:
- intentional,
- consistent with the strategy,
- justified by the payoff distribution,
- and compensated by larger outlier winners.
If not, the system may be generating opportunity without converting it.
This is a major source of hidden expectancy leakage.
Capture Efficiency
A useful concept derived from MFE is capture efficiency.
Capture efficiency describes the proportion of available favorable excursion that became realized profit.
Conceptually:
Capture Efficiency = Realized Positive Outcome ÷ Maximum Favorable Excursion
If a trade reaches 2R and closes at 1R, it captured 50% of the available favorable movement.
If it reaches 4R and closes at 0.50R, it captured only a small portion.
Capture efficiency should not be judged with a universal target.
Different strategies have different missions.
A static-target system may reasonably capture a large portion of available movement.
A trend-following system may accept lower capture efficiency in exchange for access to rare, outsized winners.
The metric becomes useful when compared:
- across similar trades,
- across the same management style,
- and across a sufficient sample.
The objective is not to capture the exact top.
That is impossible in real time.
The objective is to determine whether the exit process is converting opportunity in a repeatable and intentional way.
The MFE of Losing Trades
One of the most neglected analyses in trading is studying how far losing trades moved into profit before failing.
A trade may finish at −1R but previously reach:
- +0.40R,
- +0.80R,
- +1R,
- or more.
If many losing trades first generate meaningful favorable excursion, the setup may not be the primary problem.
The weakness may lie in:
- profit protection,
- exit timing,
- break-even policy,
- or the relationship between the management method and the market regime.
This does not mean every profitable fluctuation should be protected.
Moving a stop too quickly can damage expectancy.
But repeated patterns deserve investigation.
The MFE of losers helps answer:
Are trades failing immediately, or are they working before they fail?
Those are very different problems.
The MAE of Winning Trades
The reverse analysis is equally useful.
How much adverse movement do winning trades typically require?
If winners usually remain well away from the stop, that may indicate:
- strong entry precision,
- excessive stop width,
- or both.
If winners routinely approach the stop before working, it may indicate:
- noisy execution,
- poor timing,
- or a strategy that naturally requires more breathing room.
The trader should not immediately tighten stops because historical winners showed low MAE.
Changing the stop changes the strategy's distribution.
But the pattern provides a valuable research question:
Is the current risk distance structurally necessary, or is it compensating for inefficient entries?
That is the type of question serious attribution should produce.
Why Averages Are Not Enough
Average MAE and average MFE are useful, but they can hide important structure.
An average MAE of 0.40R may come from:
- a consistent cluster near 0.40R, or
- many clean trades near 0.10R combined with a few extreme outliers.
Those cases should not receive the same interpretation.
Likewise, average MFE may be distorted by one or two large trend trades.
A serious review therefore considers the distribution:
- typical values,
- medians,
- clusters,
- outliers,
- and differences across comparable trade groups.
The objective is not to find one perfect number.
It is to understand the shape of execution behavior.
Static and Trend Trades Should Not Be Judged the Same Way
A major attribution error occurs when every trade is evaluated under the same standard.
A static trade and a trend trade serve different purposes.
Static trade logic
A static trade is generally designed to monetize a defined movement with a predetermined profit structure.
For these trades, repeatedly high MFE with weak realized outcomes may indicate poor conversion.
Trend trade logic
A trend trade is designed to remain exposed to continued movement.
It may accept:
- greater giveback,
- longer holding time,
- wider outcome dispersion,
- and lower capture efficiency on individual trades.
The justification is the possibility of larger right-tail outcomes.
The correct question is not:
“Why did this trend trade fail to capture most of its MFE?”
The better question is:
“Does this management method produce enough large realized outcomes across the sample to justify the giveback?”
That is a portfolio-level question, not a one-trade judgment.
MAE/MFE Is Not a Signal Generator
Excursion analysis is retrospective.
It evaluates completed trades.
It should not be confused with an entry signal or live prediction engine.
MAE and MFE cannot tell you exactly where the next trade will reverse.
They cannot guarantee the best stop distance.
They cannot identify the future high or low.
Their value lies in diagnosis.
They help answer:
- what types of trades enter cleanly,
- which conditions create opportunity,
- where favorable movement is being lost,
- and whether the trading process behaves as intended.
The purpose is not hindsight perfection.
The purpose is evidence-based refinement.
Common Misuses of MAE and MFE
Trying to capture 100% of MFE
The maximum favorable point is known only after the trade ends.
Designing exits around hindsight peaks creates unrealistic expectations.
Tightening stops automatically
Low historical MAE does not prove a tighter stop will preserve the same winners.
A tighter stop changes the strategy.
Redesigning rules from a tiny sample
A handful of trades can be dominated by noise.
Patterns need sufficient evidence.
Ignoring market regime
The same setup can produce different excursion behavior in quiet, expanding, or unstable markets.
Comparing incompatible trade types
A static trade and a trend runner should not share identical performance expectations.
Treating every giveback as failure
Some giveback is the cost of pursuing larger moves.
The question is whether that cost is justified.
From Trade Records to Execution Intelligence
A basic journal tells you what happened.
An advanced trading system explains why.
That progression looks like this:
Outcome → Trade Path → Execution Attribution → Process Diagnosis
MAE and MFE sit at the center of that progression.
They help reveal whether performance is being driven by:
- good entries,
- strong opportunity selection,
- efficient monetization,
- favorable variance,
- or hidden execution leakage.
This is why excursion analysis is so valuable.
It brings structure to the space between entry and exit.
Final Perspective
Most traders judge their trades by the final number.
But the final number can lie by omission.
It can hide:
- poor entry timing,
- excessive adverse pressure,
- missed opportunity,
- avoidable giveback,
- or a winning result created by luck rather than process.
MAE and MFE expose that missing layer.
They show whether a trade entered cleanly, how much opportunity it created, and whether the execution converted that opportunity effectively.
They do not replace expectancy, drawdown analysis, or risk management.
They deepen them.
A trade result tells you what the market paid.
Excursion analysis tells you what the trade demanded—and what it offered—before the payment arrived.
That is the difference between recording performance and understanding it.
The Montex AlphaRail Perspective
Within the Montex AlphaRail System, execution is not judged only by profit or loss.
The broader objective is to determine whether trading behavior is consistently converting market opportunity into controlled, repeatable performance.
MAE and MFE contribute to that process by revealing the quality of the trade path without pretending that one isolated statistic can explain the entire system.
The underlying philosophy is straightforward:
- Outcomes matter.
- Execution quality matters.
- Opportunity conversion matters.
- And no single result should be mistaken for proof of edge.
MARS is designed to turn trading evidence into structured intelligence while keeping its proprietary analytics, governance logic, and operating architecture behind the customer layer.
Montex AlphaRail System
Turning Expectancy into Alpha.