

A backtest does not become trustworthy at 100, 200, or 1,000 trades by magic. Reliability depends on precision, independence, regime coverage, implementation realism, and how many research decisions were tried before the winning version was selected.
The False Comfort of a Large Trade Count
Forex traders often ask for a minimum number: Is 100 trades enough? Should I wait for 200? Is 1,000 the professional standard? The question is understandable, but the raw count is not the quantity that ultimately matters. A sample is useful only to the extent that it contains independent and relevant information about the strategy's future operating environment.
Two backtests can each contain 300 trades and carry completely different evidentiary weight. One may span eight years, multiple monetary-policy cycles, volatile and quiet sessions, widening and normal spreads, and both favorable and hostile conditions. The other may contain 300 EUR/USD scalps from a narrow three-month trend. The second test has more repetition than variety. It may be large in rows and small in information.
The practical conclusion is blunt: trade count is a screening metric, not a certificate of validity. It can tell you when a sample is obviously too small. By itself, it cannot tell you when an edge is production-ready.
Sample Size Answers a Precision Question
A sample does not prove that an observed win rate, expectancy, or profit factor is the strategy's permanent truth. It gives an estimate with uncertainty. As the number of genuinely informative observations rises, that uncertainty usually narrows. The correct question is therefore not, “How many trades do I have?” but, “How wide is the plausible range around the performance estimate I am using to make a risk decision?”
Win-rate uncertainty
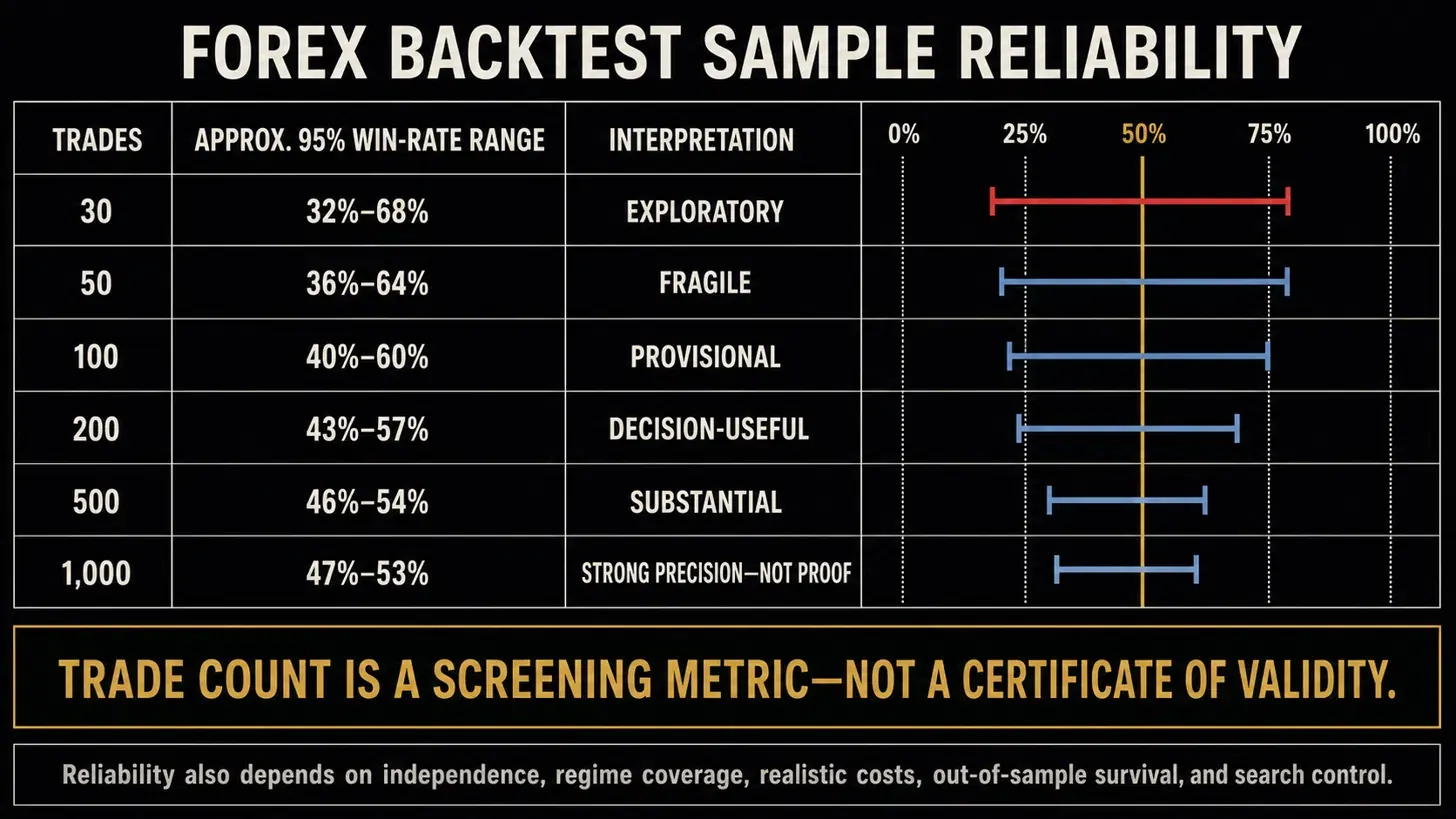
Suppose a strategy wins 50% of its trades. Even if trades were independent — a strong assumption in Forex — the observed percentage will move around from sample to sample. The table below shows approximate 95% uncertainty ranges around a 50% win rate. These are planning estimates, not universal acceptance thresholds.
| Trades | Approx. 95% range around 50% | What it means operationally |
|---|---|---|
| 30 | 32% to 68% | Exploratory. A few outcomes can radically change the estimate. |
| 50 | 36% to 64% | Still fragile. Useful for finding obvious defects, not authorizing meaningful risk. |
| 100 | 40% to 60% | Better, but a reported 50% rate can still be consistent with materially weaker or stronger reality. |
| 200 | 43% to 57% | Decision-useful when the sample is representative and dependence is limited. |
| 500 | 46% to 54% | Much tighter, but still vulnerable to regime concentration, costs, and model selection. |
| 1,000 | 47% to 53% | Strong precision for win rate alone; not proof that payoff quality or future stationarity will persist. |
Win rate is only one input. A 42% win-rate strategy with 2.0R average winners may be superior to a 62% win-rate strategy with small winners and occasional large losses. This is why sample-size analysis must move from hit rate to the distribution of net trade outcomes.
Expectancy uncertainty
For a strategy measured in risk units, net expectancy can be written as:
E[R] = P(win) × AvgWin[R] − P(loss) × AvgLoss[R] − AvgCosts[R]R is the initial risk unit. Costs should include spread, commission, slippage, and applicable financing.
The estimate of average R becomes more precise as useful observations increase, but the speed of convergence depends on outcome variance. A tight-distribution strategy can become estimable faster than a positively skewed trend strategy whose economics depend on a small number of outsized winners. If three rare runners create most of the backtest's profit, a sample of 200 trades may still tell you very little about the true frequency and size of those runners.
Approximate confidence interval for mean R = MeanR ± critical value × ( StdDev[R] / √n_eff )For small, skewed, fat-tailed, or dependent samples, use a dependency-aware bootstrap rather than trusting a simple normal approximation.
Raw Trades Are Not the Same as Independent Trades
The standard formulas taught in introductory statistics assume observations are independent and identically distributed. Trading data rarely satisfy that cleanly. Outcomes can cluster because the same market regime, currency factor, session, signal family, or position-management decision affects several trades at once.
Why dependence is especially important in Forex
- Shared currency exposure. Long EUR/USD and long GBP/USD can both express a short-US-dollar position. Counting them as two independent confirmations can exaggerate the information in the sample.
- Overlapping positions. Four entries opened during the same London move may be four tickets but one economic event.
- Session clustering. A strategy that fires repeatedly during the same volatility burst can produce correlated wins or losses.
- Regime persistence. Trend, compression, risk-off, and central-bank repricing states can last for weeks or months, creating streaks that are structural rather than random.
- Shared exit logic. A trailing-stop or partial-profit rule can make outcomes depend on the same volatility path, especially when positions overlap.
- Calendar concentration. A sample dominated by one rate cycle, one crisis, or one unusually directional year is not diversified evidence.
A common approximation expresses effective sample size as a discount to the raw number of observations:
n_eff ≈ n / ( 1 + 2 × Σ relevant return autocorrelations )This is a diagnostic approximation under stationarity, not a universal plug-in rule. Estimate dependence at the level that matches the strategy's actual decision cycle.
If 200 trades behave like repeated exposure to 80 independent market events, the uncertainty should be calculated closer to 80 than to 200. The exact effective count is model-dependent, but the principle is not: correlated evidence must be discounted.
Practical rule. When several trades share the same currency factor, setup window, regime, or market impulse, calculate both ticket count and event count. Risk decisions should lean toward the smaller, more conservative information count.
The Five Dimensions of Sample Reliability
A defensible Forex backtest should be graded across five separate dimensions. A large number in one dimension does not cancel a failure in another.
1. Statistical precision
Are the confidence intervals around net expectancy, win rate, average win, average loss, drawdown, and risk-adjusted performance narrow enough for the decision being made? The higher the intended live risk, the tighter the required uncertainty should be.
2. Independence and concentration
How many independent opportunities or market events does the sample contain? Examine serial correlation, overlapping trades, same-day clusters, common base or quote currencies, and branch-level correlation. A portfolio of pairs can be economically concentrated even when the symbols differ.
3. Regime and environment coverage
Does the sample include the conditions under which the strategy is supposed to operate — and the conditions under which it should struggle? For Forex, this may include trend and range states, volatility expansion and compression, major central-bank cycles, risk-on and risk-off periods, London/New York overlap, rollover, holidays, and abnormal spread conditions.
4. Implementation realism
Were spreads time-varying? Were commissions, slippage, swap or financing, rejected orders, latency, session availability, and broker-specific price construction represented honestly? A statistically large fantasy is still a fantasy. The Bank for International Settlements describes FX as an enormous decentralized OTC market; the diversity of instruments, venues, counterparties, and execution modes is precisely why a retail backtest must model its own route to market rather than appeal to headline market liquidity.
5. Research-process integrity
How many variants were tested before the winner was chosen? Every indicator length, stop multiple, session filter, pair basket, exit rule, and exception is another opportunity to fit noise. A 1,000-trade backtest selected from 2,000 hidden experiments may be less trustworthy than a 250-trade result generated from a pre-registered hypothesis with untouched out-of-sample data.
Why ‘100 Trades’ Is a Weak Universal Rule
The popular 100-trade benchmark is not useless. It is simply too blunt to function as proof. It can be a reasonable minimum for moving beyond anecdote, especially for a stable, high-frequency setup with limited dependence. It is inadequate when outcomes are skewed, trades cluster, the strategy is regime-specific, or many configurations were tried.
| Reliability tier | Raw sample | Permitted interpretation |
|---|---|---|
| Exploratory | Under 30 trades | Debug logic, data, and execution assumptions. Do not infer stable edge. |
| Fragile | 30–99 trades | Estimate broad behavior and locate failure modes. No aggressive live-risk conclusions. |
| Provisional | 100–199 trades | Form a working estimate if event count and regime coverage are acceptable. |
| Decision-useful | 200–499 trades | Support limited deployment when out-of-sample, cost, and dependency tests agree. |
| Substantial | 500+ trades | Stronger estimation, subject to model-selection, non-stationarity, and representativeness checks. |
These tiers are governance labels, not laws of statistics. A weekly swing strategy may need a decade to accumulate 300 trades, during which the market structure can change. A one-minute strategy may generate 300 trades in weeks, but many may be near-duplicates from the same conditions. Sample quality and strategy horizon must be evaluated together.
A Dependency-Aware Forex Validation Architecture
The strongest process does not look for one decisive backtest. It builds several layers of evidence that fail for different reasons. Agreement across layers is more valuable than a spectacular result in any single layer.
- Define the hypothesis before optimization. State the market behavior, setup, entry, exit, cost model, eligible pairs, sessions, and failure conditions. Separate economic reasoning from parameter values.
- Audit the data. Check timestamp alignment, time zone and daylight-saving treatment, bid/ask construction, gaps, duplicate bars, rollover, symbol specifications, and whether the historical feed resembles the intended broker environment.
- Create a development sample and a protected holdout. Use the development period to build. Do not repeatedly inspect the holdout and call it out-of-sample; once it influences design, it has become part of research.
- Use walk-forward testing. Re-estimate or select rules only using information available at each historical point, then test on the next unseen segment. Aggregate the sequential out-of-sample segments.
- Measure event-level dependence. Group overlapping trades, same-signal entries, and strongly related pair exposures. Report ticket count, trade-day count, setup-event count, and effective sample size.
- Resample in blocks. For Monte Carlo or bootstrap analysis, preserve meaningful clusters — such as trading days, sessions, or regime blocks — instead of randomly shuffling individual tickets when independence is implausible.
- Stress costs and execution. Re-run with wider spreads, adverse slippage, delayed entry, worse exits, missed trades, swap variation, and plausible broker friction. An edge that disappears under mild friction is not production-grade.
- Test parameter neighborhoods. A robust strategy should survive small changes to stop distance, lookback, time window, and threshold. A single sharp peak is evidence of fragility, not precision.
- Run a forward shadow phase. Paper trade or log signals in real time without design changes. Confirm that live signal frequency, fills, costs, and behavior resemble the historical model.
- Promote risk gradually. Move from research to micro-risk, then to normal authority only after live evidence remains inside predefined expectancy, drawdown, and compliance bands.
What to Measure Beyond Total Trades
A reliable validation report should make concentration visible. At minimum, publish the following alongside the headline performance:
- Raw ticket count and unique setup-event count.
- Trade days, weeks, months, and years represented.
- Counts by pair, currency, session, weekday, long/short direction, and strategy branch.
- Counts and expectancy by volatility and market-regime bucket.
- Percentage of profit contributed by the best day, best week, best pair, and top 5% of trades.
- Win rate, average win, average loss, net expectancy, standard deviation, skewness, and tail-loss behavior.
- Maximum drawdown, drawdown duration, recovery time, loss clustering, and longest losing sequence.
- Gross versus net results after spread, commission, slippage, swap, and other implementation costs.
- In-sample, walk-forward out-of-sample, protected holdout, and live-forward results shown separately.
- Number of tested configurations and the selection rule used to choose the final version.
The Multiple-Testing Problem: Your Sample Can Be Large and Still Be Overfit
Backtest reliability falls as researcher freedom rises. If you test enough parameter combinations, some will look exceptional by chance. The danger is not limited to machine learning. Manual strategy development can create the same bias through repeated chart review, discretionary exclusions, pair selection, and post-hoc explanations.
Research on the probability of backtest overfitting formalizes this problem by asking how often the best in-sample configuration underperforms out of sample. Related work on the Deflated Sharpe Ratio adjusts performance evidence for non-normal returns and the number of trials. Reality-check and superior-predictive-ability procedures address data snooping when many rules compete. The trader does not need to turn every project into an academic paper, but the principle must enter the workflow: disclose the search, penalize complexity, and reserve genuinely untouched data.
Red flag. If the final strategy can only be explained as a long list of exceptions discovered after seeing the results, the effective research sample is smaller than it appears and the model-selection risk is larger than the report admits.
A Worked Forex Example: 240 Trades That Behave Like Far Fewer
Consider a London-session continuation strategy tested across EUR/USD, GBP/USD, EUR/JPY, and GBP/JPY. The report shows 240 trades, 0.24R net expectancy, a 47% win rate, and a 1.31 profit factor. At first glance, the sample looks respectable.
The concentration audit changes the interpretation:
- Seventy-eight trades occurred as overlapping pair entries during only 31 market impulses.
- Fifty-six percent of total profit came from two high-volatility quarters.
- GBP-related pairs produced 64% of the net R.
- The top eight winners contributed 41% of total profit.
- The cost model used a constant spread and no adverse slippage around London data releases.
- Twelve stop and trailing-exit combinations were tested before the reported version was selected.
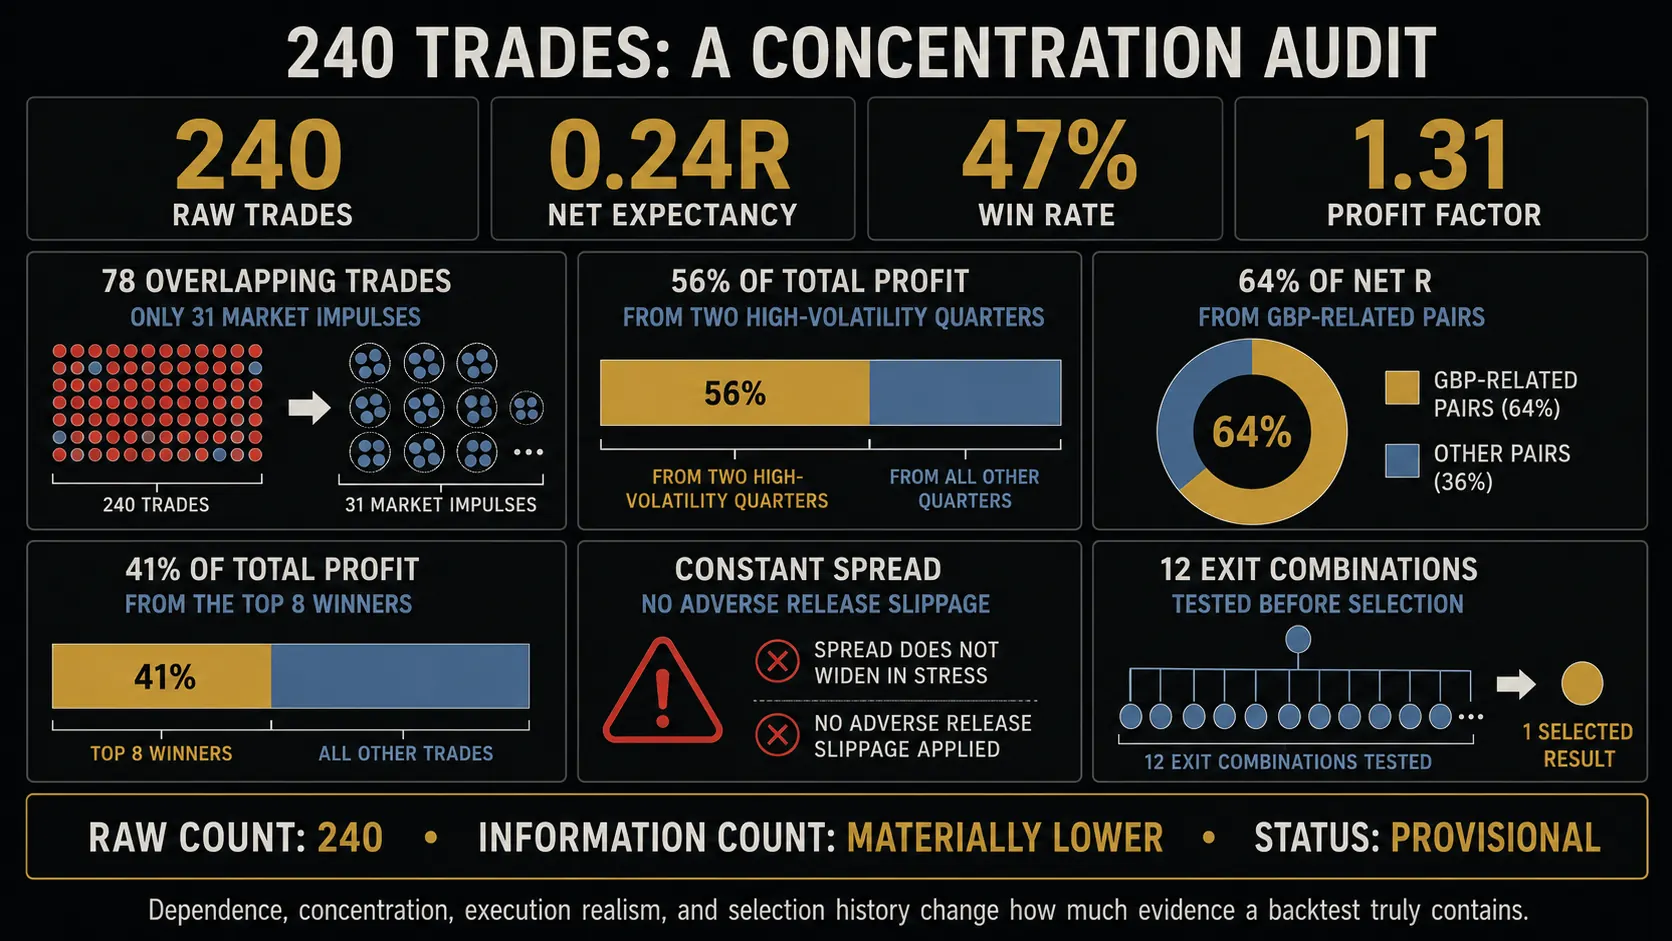
The correct conclusion is not that the strategy is invalid. It is that 240 is an optimistic description of the evidence. The strategy should be labeled provisional until it survives an untouched period, block-based resampling, stressed execution costs, and additional observations outside the two dominant quarters.
Now imagine a second test with only 180 tickets but 150 distinct trade days, no overlapping positions, balanced performance across pairs and regimes, conservative variable costs, a pre-specified rule set, and a clean walk-forward holdout. The smaller raw sample may be the stronger validation.
Set the Required Sample From the Decision, Not From Tradition
The amount of evidence required should scale with the consequence of being wrong. Research exploration, micro-risk deployment, full-risk production, and capital allocation across multiple branches should not use the same evidentiary threshold.
| Decision | Minimum evidence standard | Risk implication |
|---|---|---|
| Continue research | Plausible mechanism, clean data, enough trades to expose obvious defects. | No capital authority. |
| Forward shadow | Stable rules, preliminary precision, acceptable concentration, realistic costs. | No or simulated risk. |
| Micro-risk pilot | Positive walk-forward evidence, stress-test survival, controlled dependency, predefined monitoring bands. | Small, reversible risk. |
| Normal deployment | Multiple validation layers agree and live results remain statistically and operationally consistent. | Normal strategy authority. |
| Scale capital | Sufficient live sample across relevant regimes; attribution shows returns are not carried by one fragile source. | Increase only within portfolio and drawdown limits. |

This decision-based approach avoids two common errors: demanding an impossible number of trades before learning anything, and authorizing serious risk because an arbitrary count was reached.
A Practical Reliability Scorecard
Before promoting a Forex strategy, grade each dimension from 0 to 2. The score is intentionally conservative: a severe failure should block deployment even if the total appears acceptable.
| Dimension | 0 — weak | 1 — provisional | 2 — strong |
|---|---|---|---|
| Precision | Intervals too wide for decision | Usable but material uncertainty | Intervals fit the risk decision |
| Independence | Heavy clustering ignored | Dependence measured | Event-level evidence diversified |
| Regime coverage | Narrow condition set | Several relevant states | Broad favorable and adverse coverage |
| Cost realism | Idealized fills or fixed friction | Basic variable costs | Stressed broker-realistic costs |
| Out-of-sample | None or repeatedly reused | Single protected segment | Walk-forward plus protected/live evidence |
| Parameter stability | Single sharp optimum | Mixed neighborhood | Broad stable plateau |
| Search control | Trials undocumented | Search recorded | Pre-specified logic and selection penalty |
| Concentration | Profit dominated by one source | Some concentration | Balanced or explicitly governed |
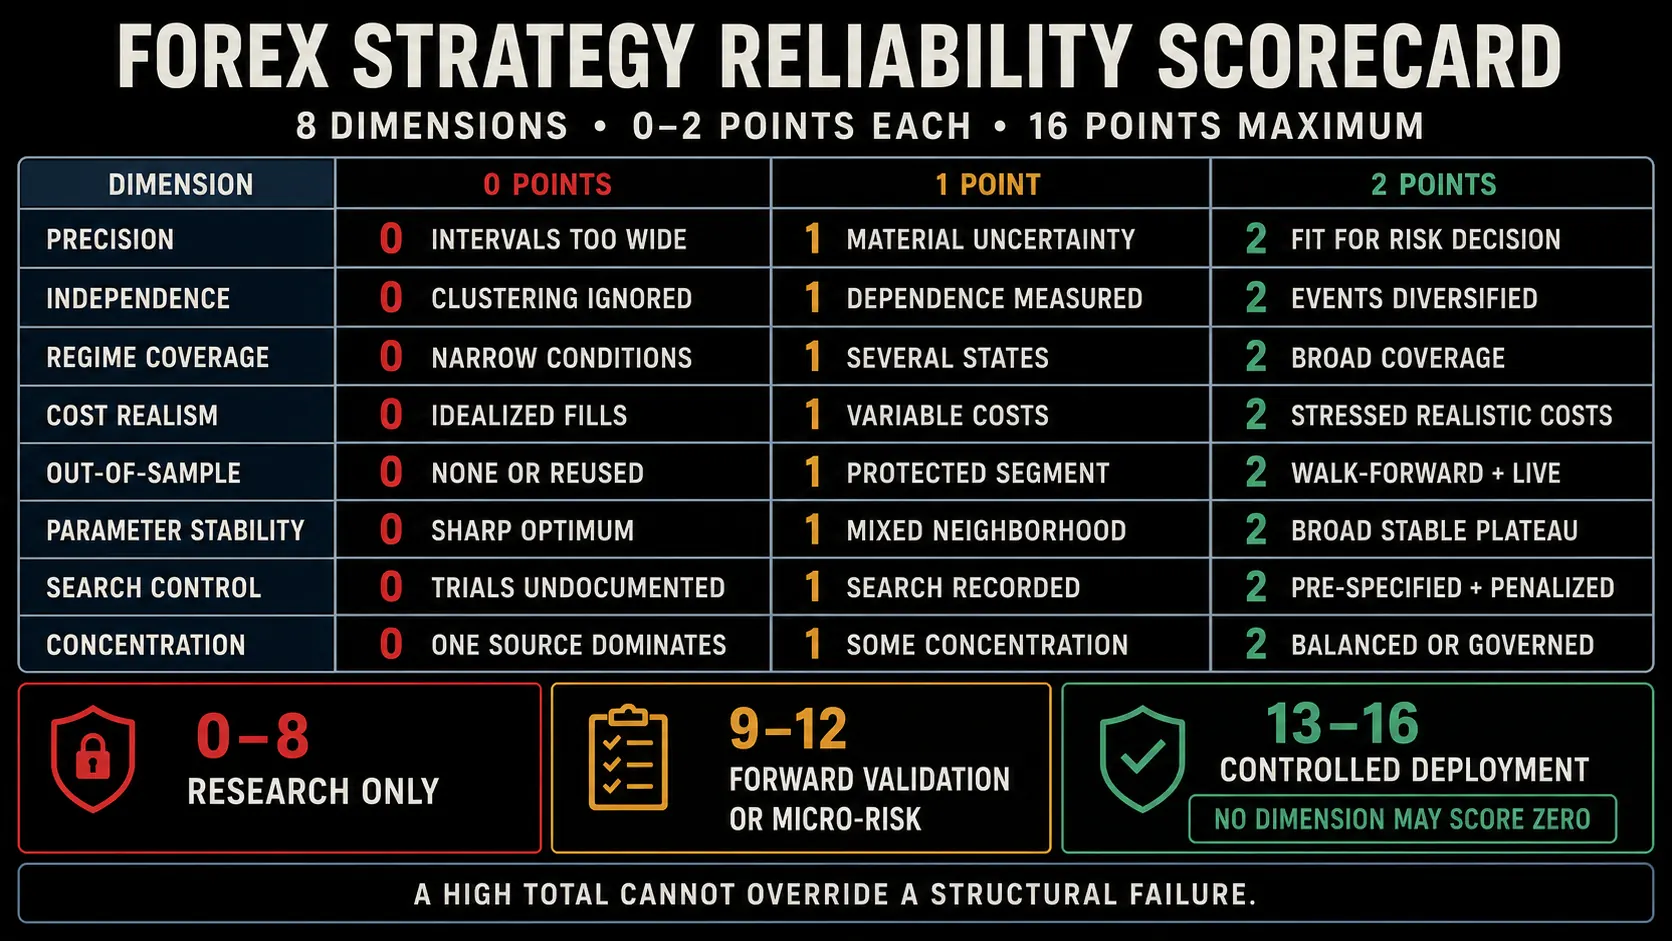
A score of 13–16 can support controlled deployment if no dimension is zero. A score of 9–12 supports continued forward validation or micro-risk only. A score below 9 belongs in research. This is a governance framework, not a statistically universal theorem; its purpose is to stop one impressive metric from overruling structural weaknesses.
Common Mistakes That Inflate Reliability
- Counting scale-in entries as independent trades. Several tickets from one setup do not create several independent forecasts.
- Pooling unlike strategies. Combining mean reversion, breakout, and trend branches can make the total sample look large while leaving each decision rule under-tested.
- Ignoring pair overlap. Symbol diversification is not factor diversification when the same currency drives the book.
- Optimizing on the holdout. Repeatedly checking an out-of-sample segment turns it into training data.
- Using a static spread. Forex costs vary by pair, session, news, liquidity, broker, and account type.
- Shuffling individual trades in Monte Carlo. Random shuffles can destroy the exact loss clustering and regime persistence the risk test should preserve.
- Treating profit factor as stable. A few large winners or avoided losses can move the ratio sharply in small or skewed samples.
- Annualizing short samples. A strong month does not become a reliable annual return merely by multiplication.
- Changing rules during forward testing. Every material change resets the evidence clock for the affected logic.
The Bottom Line
There is no honest universal answer to how many Forex trades make a backtest reliable. One hundred trades can move a strategy beyond storytelling, but it rarely settles the question. Two hundred to five hundred well-distributed, dependency-aware observations can support useful decisions for many strategies. Even thousands of trades can mislead when they come from a narrow regime, idealized execution, overlapping exposure, or a large undisclosed optimization search.
The professional standard is not a magic count. It is a chain of evidence: statistically adequate precision, independent opportunity coverage, realistic implementation, controlled research freedom, out-of-sample survival, and gradual confirmation in live conditions.
A backtest should not answer, “How much could this strategy have made?” Its more important job is to answer, “How wrong could this estimate be, what conditions produced it, and how much capital authority is justified by the evidence?” That is the point where backtesting stops being promotional and becomes risk engineering.
Research Notes and Sources
- Bank for International Settlements, “OTC foreign exchange turnover in April 2025.” Used for current market-structure context: OTC FX turnover, instruments, currencies, and counterparties.
- Bailey, Borwein, López de Prado, and Zhu, “The Probability of Backtest Overfitting.” Supports the discussion of configuration search and in-sample selection risk.
- Bailey and López de Prado, “The Deflated Sharpe Ratio.” Supports adjusting performance evidence for multiple trials and non-normal return features.
- Hsu and Kuan, “Reexamining the Profitability of Technical Analysis with Data Snooping Checks.” Supports the use of reality-check and superior-predictive-ability methods when many rules compete.
- Bühlmann, “Bootstraps for Time Series.” Supports dependency-aware block and time-series bootstrap methods.
- Getmansky, Lo, and Makarov, “An Econometric Model of Serial Correlation and Illiquidity in Hedge Fund Returns.” Supports the broader warning that serial correlation can materially distort risk-adjusted performance interpretation.
Editorial note. This article is educational and analytical. It does not constitute investment advice, a promise of performance, or a universal statistical standard. Validation thresholds should be calibrated to the strategy, data, execution venue, and capital risk.