

The average tells you whether an edge exists. The distribution tells you what it will cost to live through it.
The Problem: Traders Memorize EV and Ignore the Distribution
Expected value is one of the most useful ideas in trading because it forces a trader to stop asking, “Did this trade win?” and start asking, “What does this decision produce on average across a large number of repetitions?” But the moment EV is reduced to a single number, it becomes dangerously easy to misuse. Two strategies can have the same expected value and produce radically different win rates, loss streaks, drawdowns, emotional demands, fee sensitivity, and compounding paths.
That matters in foreign exchange because the market is deep, leveraged, continuous across major sessions, and traded through multiple instruments and execution venues. The Bank for International Settlements reported average OTC FX turnover of $9.6 trillion per day in April 2025. Scale does not make the retail trader’s distribution safer; it simply means the trader is operating inside an enormous market in which execution, leverage, transaction costs, volatility regimes, and path dependency all matter.
For the intermediate-to-advanced trader, the useful question is therefore not merely whether a setup has positive EV. The more complete question is: what payoff distribution produces that EV, how stable is it, what tails does it contain, how does it behave after costs, and can the trader’s risk architecture survive the sequences that the distribution will eventually deliver?
Tagline. Positive expectancy is a statistical permission slip—not a guarantee of a comfortable equity curve.
Expected Value: The Core Equation, Properly Framed
At its simplest, a binary win/loss trading model can be expressed as:
EV = P(win) × Avg Win − P(loss) × Avg LossThe probability-weighted average payoff of the decision, not the result of the last trade.
If results are recorded in R-multiples, the equation becomes portable across account sizes. One R is the amount initially risked on the trade; +1.5R means the trade earned one and a half times that initial risk, while −1R means the original risk was lost. This makes EV a property of the trading process rather than of the account’s current dollar balance.
The MARS project uses this logic explicitly. Its Weekly Trading Scorecard converts branch probabilities into EV in R, including different formulas for Normal, Trend Partial, Trend No-Partial, and Overflow behavior. That is an important design choice: a branch with a static 2R-style runner does not have the same payoff mechanics as a no-partial trend branch designed to preserve exposure for fat-tail continuation. Treating them as one generic win-rate statistic would erase the reason the branches exist in the first place.
| Profile | Win rate | Avg win | Avg loss | EV | Distribution character |
|---|---|---|---|---|---|
| A | 70% | +0.50R | −1.00R | +0.05R | High hit rate; small positive outcomes |
| B | 40% | +1.625R | −1.00R | +0.05R | Lower hit rate; larger positive outcomes |
Table 1. Illustrative profiles with identical expected value. The figures are hypothetical and are not backtested performance claims.
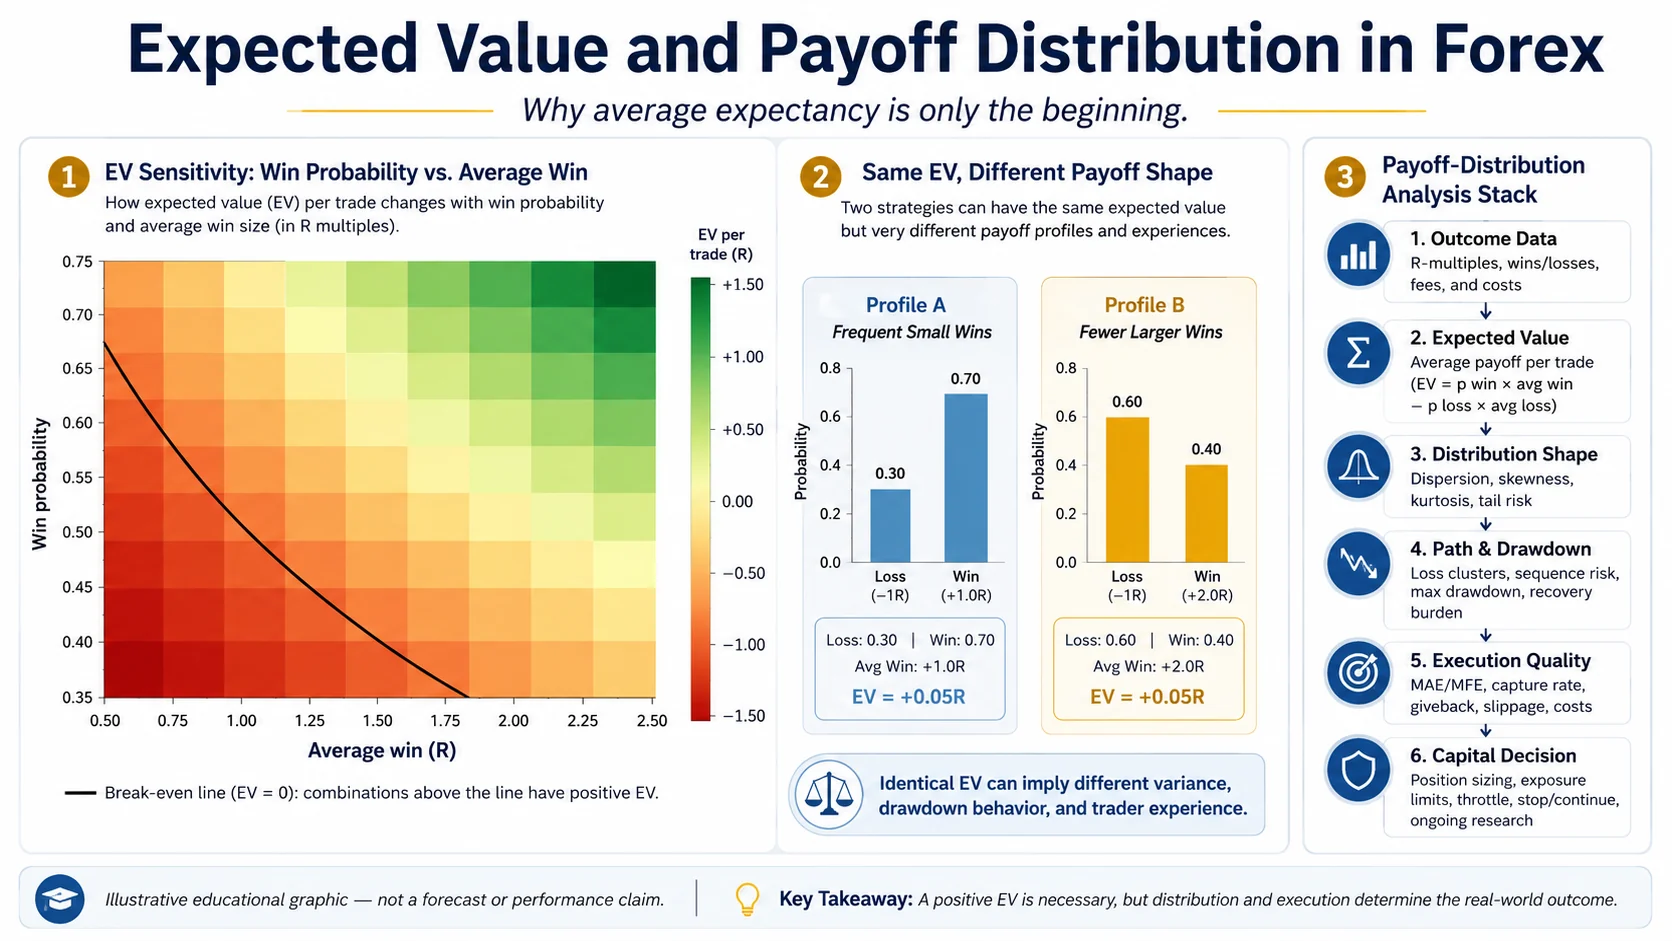
Profile A wins more often, which may feel psychologically easier, but its small average win leaves less room for slippage, spread expansion, commission, execution mistakes, or a modest drop in hit rate. Profile B loses more frequently, so it creates longer losing streaks, but its larger wins provide more payoff convexity. The same arithmetic mean can therefore hide very different survival problems.
Payoff Distribution Analysis: What EV Leaves Out
A payoff distribution is the full set of possible trade outcomes and their probabilities. The mean of that distribution is EV. But the mean is only the first moment. Professional return analysis also cares about dispersion and shape. CFA Institute materials explicitly treat expected value and variance alongside skewness and kurtosis, while NIST defines skewness as asymmetry and kurtosis as the degree to which a distribution is heavy-tailed or light-tailed relative to a normal distribution.
| Measure | What it answers | Forex relevance | Failure if ignored |
|---|---|---|---|
| Mean / EV | What is the average payoff? | Is the process positive expectancy? | Confuses a positive average with a safe path. |
| Variance / dispersion | How widely do outcomes spread? | How noisy is realization around EV? | Underestimates drawdown and sample uncertainty. |
| Skewness | Are outcomes asymmetric? | Do a few large winners or losers dominate? | Misses dependence on rare tail outcomes. |
| Kurtosis / tails | How heavy are extreme outcomes? | How often can unusual results appear? | Normal-distribution assumptions become fragile. |
| Serial dependence | Do outcomes cluster in sequence? | Trend/range regimes can cluster wins or losses. | Independence assumptions can understate streak risk. |
Table 2. A more complete distribution lens for trading outcomes.
Skew: Why “How You Win” Can Matter as Much as “How Often You Win”
Positive skew means the right tail is longer or more influential: many small or moderate outcomes are occasionally punctuated by much larger winners. Trend-following and runner-based exits are often designed to create this shape. Negative skew is the reverse: frequent small gains can be interrupted by rare but disproportionately large losses. A strategy with a high win rate can therefore be statistically unattractive if the losing tail is severe enough.
In Forex, exit architecture changes skew directly. A trader who always takes a fixed profit cap truncates the right tail. A trader who leaves a runner open may accept more giveback and a lower conversion rate in exchange for preserving access to outlier moves. The MARS branch framework makes this explicit: Trend Partial monetizes part of the move early while retaining a runner, whereas Trend No-Partial is intentionally more dependent on continuation and fat-tail capture. The difference is not cosmetic trade management; it is distribution design.
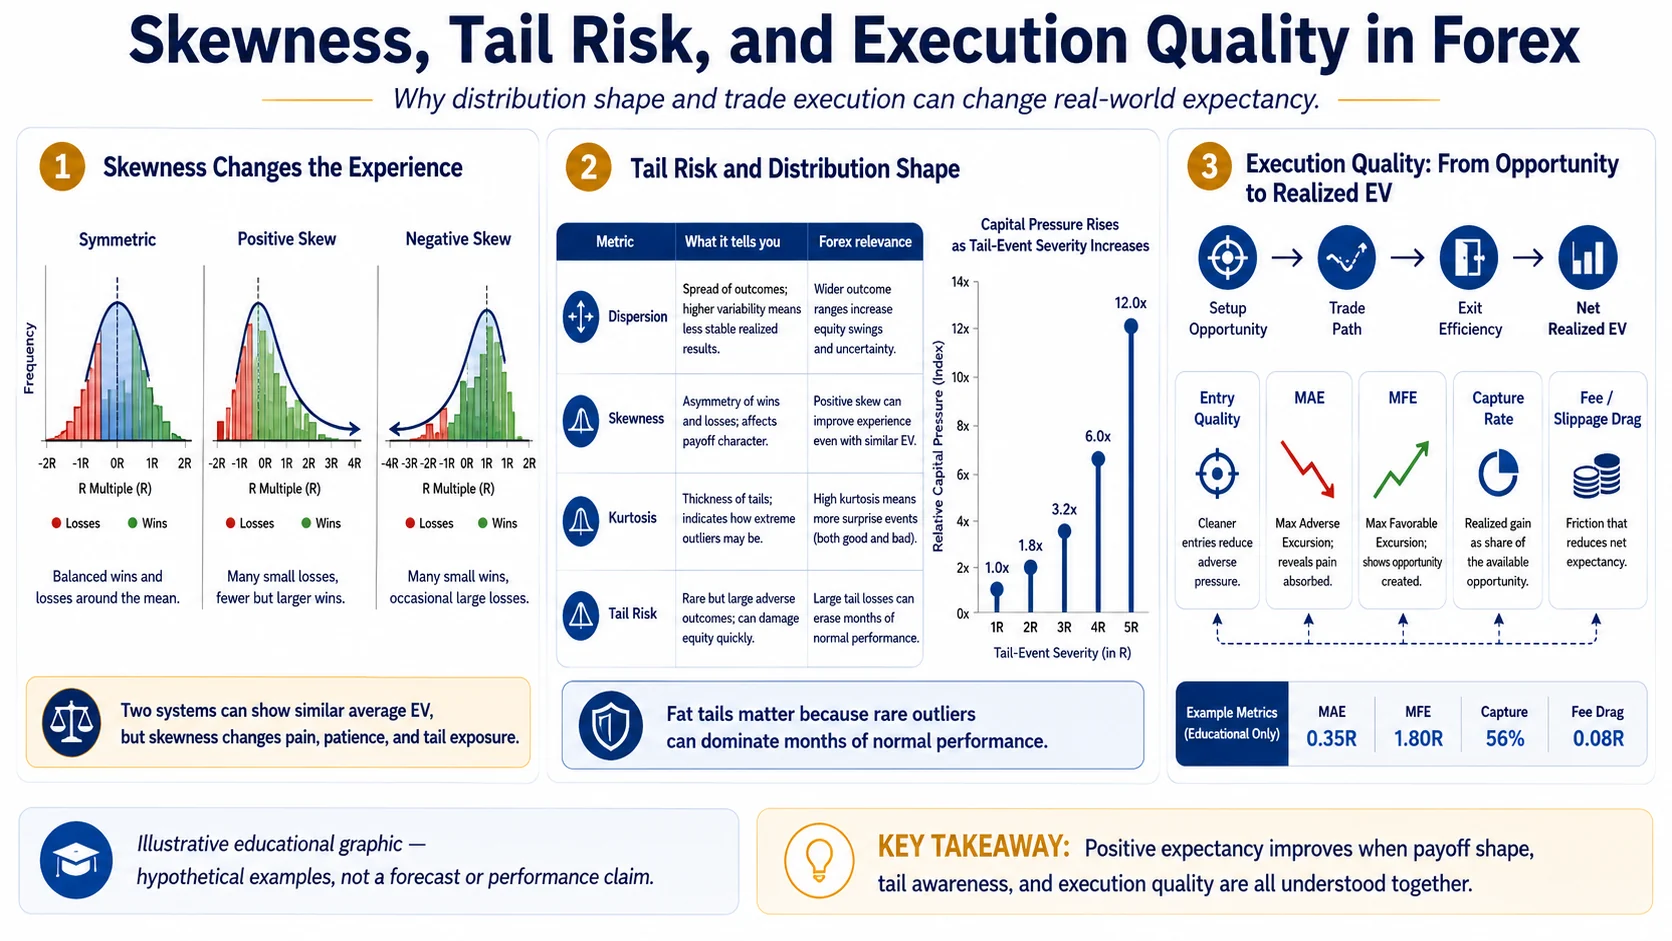
Tagline. Exit rules do not merely close trades. They manufacture the shape of your payoff distribution.
Sensitivity: A Small Change in Hit Rate or Payoff Can Move EV Across Zero
A robust trading process should not rely on one precise probability estimate. If the model is only profitable at a 61% hit rate but loses money at 59%, the edge may be too fragile for real execution. Sensitivity analysis asks how EV changes when the inputs move: hit rate falls, average win compresses, average loss expands, costs rise, or runner conversion weakens.
This is why conditional probabilities are so useful for multi-stage trade management. Instead of asking only whether a trade won, an advanced journal can measure whether it reached 1R, whether it progressed from 1R to 1.6R, whether the runner reached a further target, and what the final R distribution looked like after management. MARS uses this type of staged probability structure in its weekly EV engine, which is a better model for partials and runners than a single win/loss flag.
Sequence Risk: EV Does Not Tell You the Order of Outcomes
Expected value is order-insensitive. Capital is not. A trader can receive exactly the outcomes a model predicted and still experience a very different equity path depending on the sequence. Five losses spread across fifty trades are operationally different from five losses arriving consecutively.
Using the two hypothetical profiles above, the probability of five consecutive losses at any specific five-trade block is 0.3^5, or about 0.24%, for Profile A, versus 0.6^5, or about 7.78%, for Profile B. Both profiles have the same EV, yet one naturally produces much more frequent loss clustering. This does not make Profile B inferior; it means Profile B requires a different drawdown tolerance, position sizing policy, and psychological operating model.
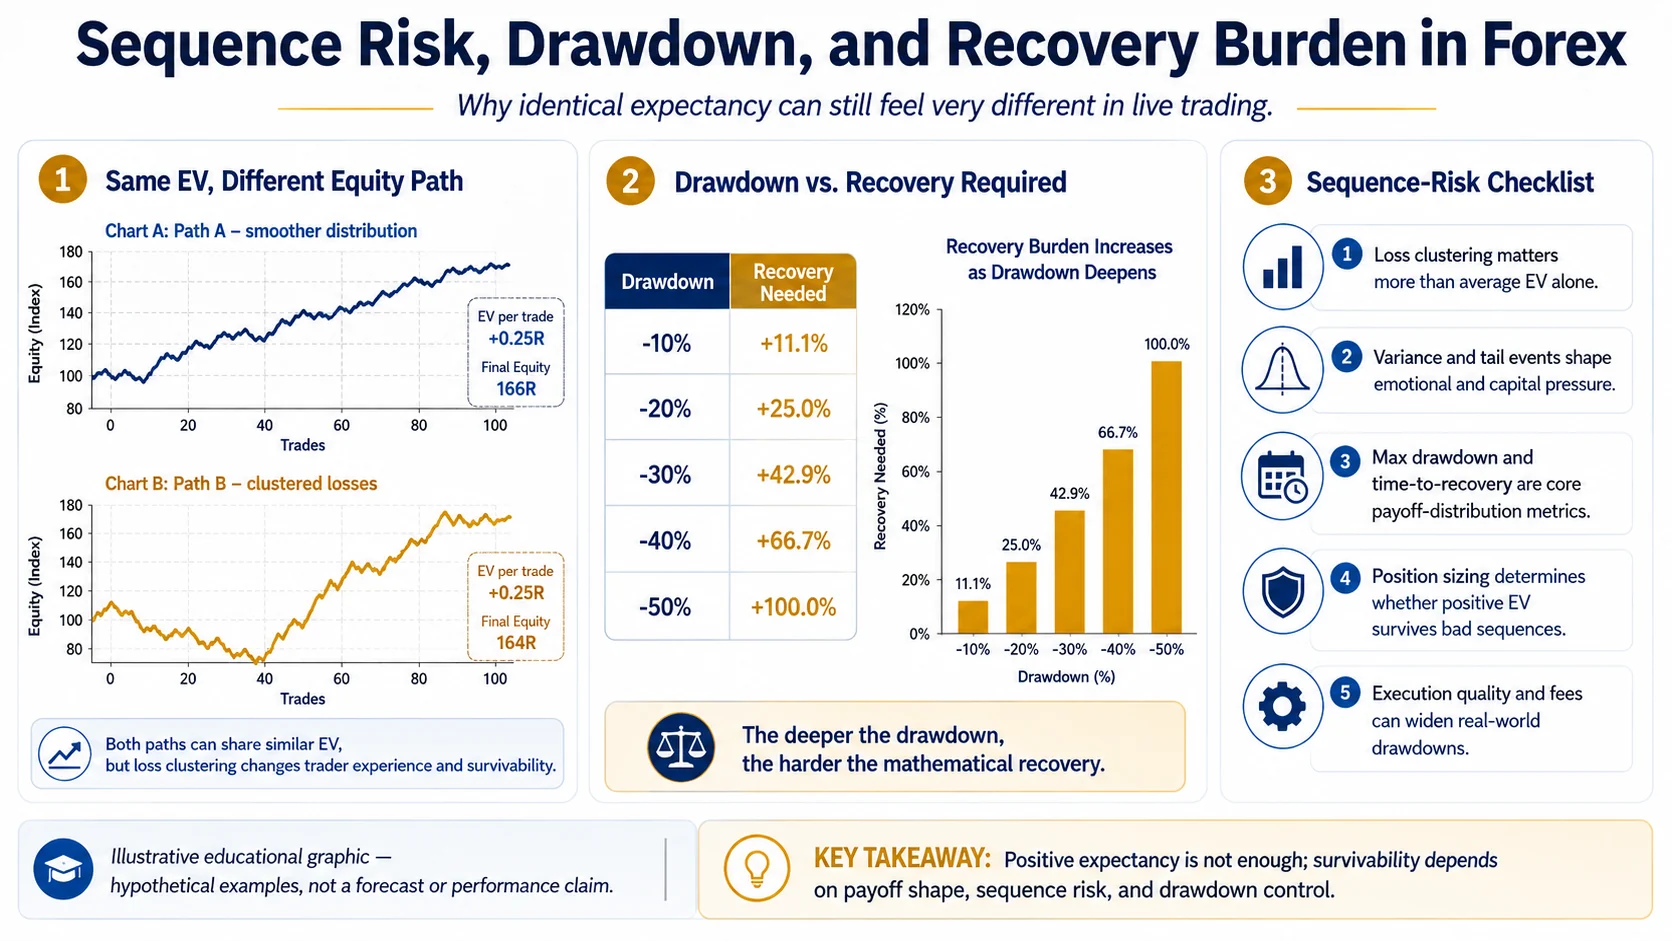
Sequence risk becomes more important under compounding because position size changes with capital. Even when arithmetic expectancy is unchanged, volatility and drawdown alter the geometric path. A simple reminder is that +20% followed by −20% does not return capital to the starting point; it leaves the account 4% lower. The lesson is not to avoid compounding, but to govern it with a distribution-aware risk process.
Forex-Specific Reality: Leverage and Friction Reshape the Distribution
Retail Forex is unusually sensitive to leverage because margin allows a trader to control a position much larger than the cash posted. The U.S. Commodity Futures Trading Commission warns that leverage amplifies both gains and losses and that a trader can lose all margin and potentially more. From a payoff-distribution perspective, leverage does not create edge. It scales the consequences of the distribution you already have.
Costs matter for the same reason. Spread, commission, slippage, swap, and poor fills shift the entire outcome distribution left. A theoretical +0.05R edge can disappear quickly if average friction is large relative to R. This is why thin positive expectancy should be treated differently from robust positive expectancy. It is also why advanced analysis should measure net R rather than gross R whenever possible.
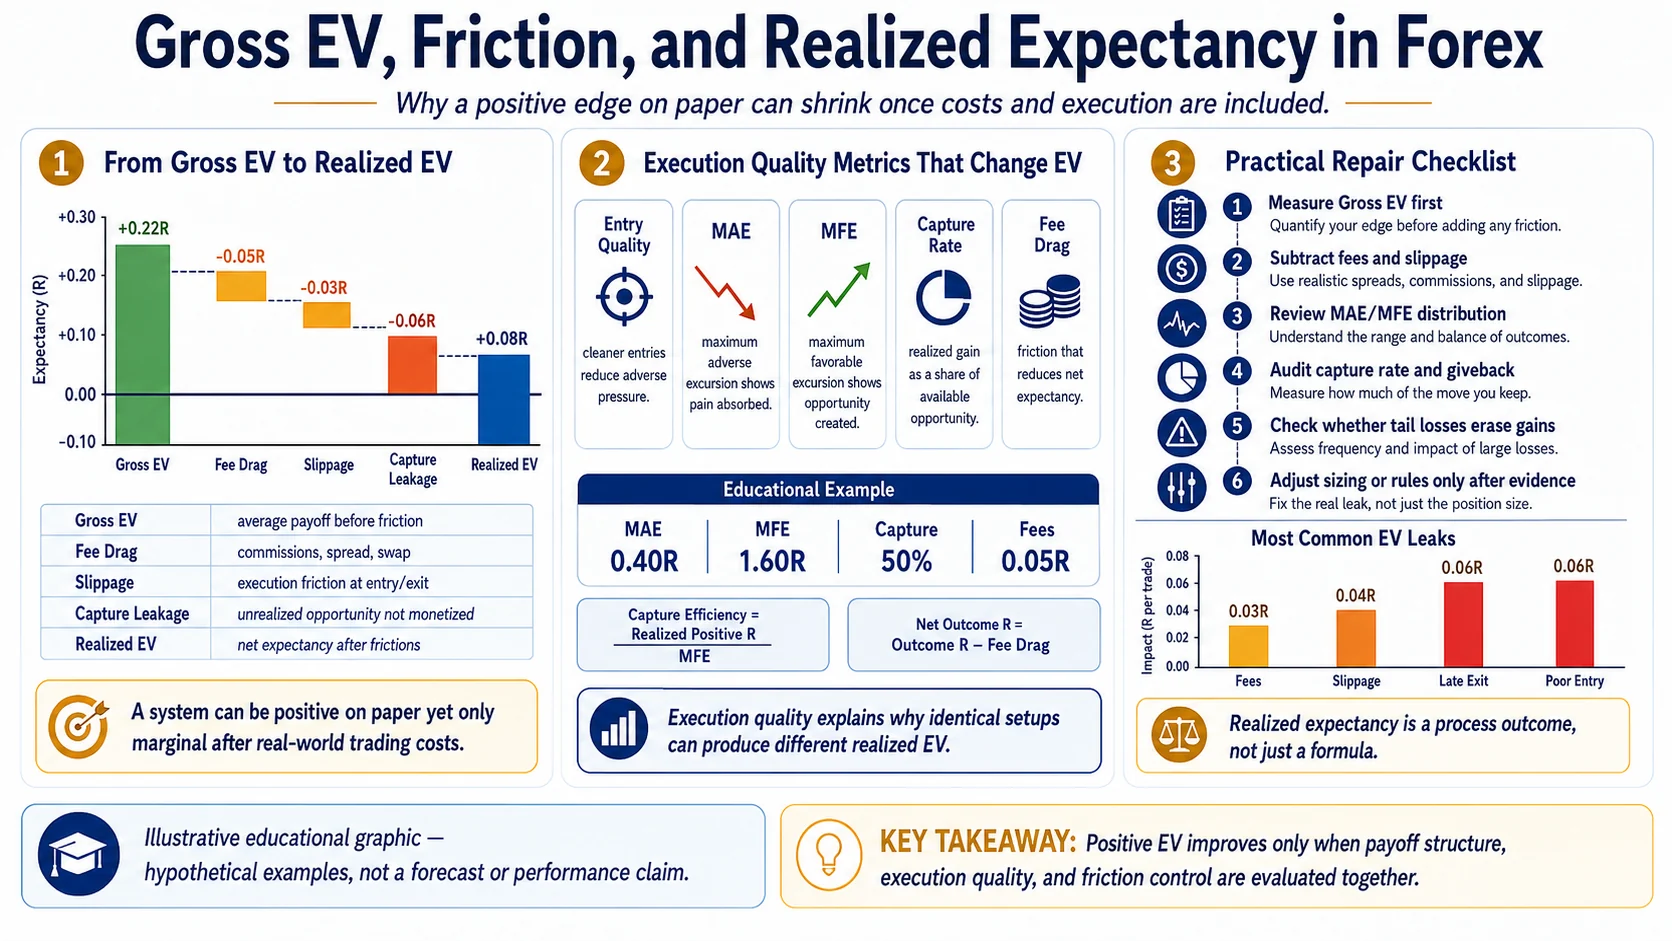
The MARS MAE/MFE Execution Efficiency Lab makes the same point from a different angle: final outcome alone is incomplete. Maximum Adverse Excursion (MAE), Maximum Favorable Excursion (MFE), capture efficiency, giveback, and fee R-drag help explain whether a strategy is producing opportunity but failing to monetize it, or whether the setup itself is weak. That diagnostic bridge is valuable for any Forex trader, even outside MARS.
A Systems Case Study: How MARS Separates EV From Governance
A useful case study is the architecture used in the Montex AlphaRail System (MARS). Its design does not treat EV as permission to deploy unlimited risk. The Weekly Trading Scorecard monitors branch and blended EV. Compliance Panel 3 also tracks drawdown, fees, branch behavior, and execution evidence. The Structural Diagnostic Engine then examines expectancy together with drawdown, risk-adjusted efficiency, risk-adjusted profit factor, and equity acceleration across rolling, stability, drift, and z-score views. Finally, gate and throttle layers retain capital authority.
The conceptual lesson is broader than the specific system: measurement and authority should be separated. EV tells you whether the process has an edge. Distribution analysis tells you what kind of edge it is. Drawdown and exposure controls tell you how much of that edge you are permitted to deploy. Execution diagnostics tell you whether the observed distribution is being distorted by the trader. Monte Carlo tells you whether the live path is behaving inside a plausible range.
The Payoff Distribution Diagnostic: What an Advanced Forex Trader Should Measure
| Diagnostic | Metric / test | Decision use |
|---|---|---|
| Is the edge positive? | Mean R / EV, net of costs | Continue analysis only if expectancy is economically meaningful. |
| Is the edge stable? | Rolling EV, standard deviation, confidence range | Distinguish drift from ordinary noise. |
| What creates the edge? | Branch/setup/session attribution | Find which component actually contributes. |
| Is the payoff asymmetric? | Skewness, median vs mean, tail contribution | Identify reliance on outlier winners or losers. |
| Are tails dangerous? | Kurtosis, worst-N outcomes, expected shortfall style review | Design risk for exceptional outcomes. |
| How does the path hurt? | Max DD, DD duration, loss clusters, time to recovery | Set survivable risk and brakes. |
| Is execution leaking EV? | MAE, MFE, capture efficiency, giveback, slippage | Repair entry/exit mechanics. |
| Does the model survive perturbation? | Sensitivity / scenario testing | Reject fragile parameter combinations. |
| Is live behavior plausible? | Monte Carlo percentile comparison | Separate normal variance from structural deterioration. |
Table 3. A practical payoff-distribution checklist for intermediate-to-advanced Forex traders.
Six Common Mistakes in Expected-Value Analysis
- Treating win rate as edge. A 70% win rate can be negative expectancy if losses are too large; a 40% win rate can be profitable if the payoff is sufficiently asymmetric.
- Using gross EV instead of net EV. Costs shift the distribution. If the edge is thin, spread, commission, swap, and slippage can erase it.
- Assuming a normal distribution. Heavy tails and skew can make standard-deviation-only thinking too optimistic. NIST notes that significant skewness and kurtosis indicate non-normal behavior.
- Ignoring conditional path probabilities. Partials and runners are multi-stage processes. Measure conversion from one checkpoint to the next instead of collapsing everything into a binary result.
- Optimizing the mean while destroying survivability. A higher EV model can still be inferior for a specific trader if it produces intolerable drawdown, rare catastrophic losses, or exposure that exceeds capital capacity.
- Changing rules after normal variance. Small samples can deviate substantially from long-run expectancy. Sensitivity, rolling windows, and Monte Carlo provide a better basis for distinguishing noise from deterioration.
A Weekly Workflow for Distribution-Aware Forex Review
- Step 1 — Normalize outcomes in R. Record every closed trade in R so different position sizes and account balances can be compared.
- Step 2 — Calculate net EV. Use realized outcomes after fees where possible; do not let gross edge masquerade as net edge.
- Step 3 — Split the distribution. Review win rate, average win, average loss, median R, best/worst outcomes, and branch/setup/session contributions.
- Step 4 — Measure shape and instability. Track standard deviation, skew, tail contribution, loss clustering, and rolling EV.
- Step 5 — Diagnose the trade path. Use MAE/MFE, capture efficiency, giveback, duration, and slippage to determine whether the problem is setup quality or execution quality.
- Step 6 — Compare with a benchmark. Use Monte Carlo or bootstrapped path simulations to understand plausible drawdown and equity ranges rather than reacting to one week.
- Step 7 — Change rules only through research. A live drawdown is not sufficient evidence to redesign a strategy. Test proposed changes out of sample or in a sandbox before promoting them to production.
Conclusion: The Distribution Is the Strategy
Expected value is still the master metric because it answers the first question every trader must resolve: does this process pay, on average, for the risk it takes? But advanced trading begins where that first answer ends. The next questions concern variance, asymmetry, tails, sequence, drawdown, costs, and execution quality.
A Forex strategy is not truly described by its win rate, its average R, or even its EV in isolation. It is described by the entire distribution of possible outcomes and by the capital-governance rules that determine whether the trader can remain solvent and consistent long enough for that distribution to express itself.
The practical standard is therefore higher than “positive expectancy.” A durable trading process should have positive net expectancy, understandable payoff shape, tolerable loss clustering, controlled tail risk, evidence that survives sensitivity analysis, and risk sizing that respects the worst plausible path rather than the average path. That is how expectancy stops being a spreadsheet statistic and becomes an operating edge.
Closing tagline. Don’t trade the average. Engineer the distribution—and govern the path.
Sources and Further Reading
External sources
- Bank for International Settlements (BIS), “OTC foreign exchange turnover in April 2025.” — Used for current global OTC FX turnover and market-structure context.
- U.S. Commodity Futures Trading Commission (CFTC), “Eight Things You Should Know Before Trading Forex.” — Used for retail Forex leverage and margin-risk context.
- CFA Institute, “Statistical Measures of Asset Returns” (2026 refresher reading). — Used for the role of expected return, dispersion, skewness, and kurtosis in return analysis.
- NIST/SEMATECH e-Handbook of Statistical Methods, “Skewness and Kurtosis.” — Used for statistical definitions of skewness, kurtosis, and non-normal distribution diagnostics.
MARS internal project sources
- Weekly Trading Scorecard v5.6c Instruction Manual — Branch-level EV formulas, blended EV, probability checkpoints, EV governance.
- MARS Hybrid Execution + EV Sensitivity Legacy Operating Manual v2 — Normal/Trend payoff architecture, conditional probabilities, EV sensitivity doctrine.
- MARS Structural Diagnostic Engine Framework & User Guide — EV combined with drawdown, RAER, RAPF, acceleration, rolling windows, stability and drift.
- MARS MAE/MFE Execution Efficiency Lab User Guide — MAE/MFE, capture efficiency, giveback, fee drag and execution-quality diagnostics.
- MARS Dynamic 7-Tier Monte Carlo Benchmark Operating Standard — Percentile benchmarking, drawdown, gate dwell, risk-tier usage and survival-adjusted interpretation.
- MARS Master System Architecture & Operator Manual v2 — Authority hierarchy separating expectancy measurement, structural diagnostics, and capital governance.
Educational note
This article is educational and analytical. Hypothetical R-multiple examples and charts are used to explain probability concepts; they are not statements of actual or expected trading performance. Forex trading involves substantial risk, and leverage can magnify losses.
Quick Reference: EV + Distribution Formula Card
| Concept | Working definition |
|---|---|
| Expected value | Probability-weighted average payoff: Σ pᵢxᵢ. |
| Net EV | Expected value after commissions, spread, slippage, swap, and other measurable friction. |
| Variance / σ | How widely outcomes disperse around the mean. |
| Skewness | Direction and degree of payoff asymmetry. |
| Kurtosis / tail weight | How heavy or light extreme outcomes are relative to a normal distribution. |
| Sequence risk | The effect of outcome ordering and clustering on the equity path. |
| MAE / MFE | Worst adverse and best favorable excursion during a trade. |
| Capture efficiency | How much available favorable excursion is converted into realized R. |
| Sensitivity analysis | How the model behaves when hit rate, payoff, costs, or other assumptions change. |
| Monte Carlo benchmark | A distribution of possible paths used to judge whether live performance is statistically plausible. |