

Core idea. A profitable record is not automatically a high-quality record. Professional performance analysis asks where the P&L came from, how much risk produced it, whether the edge is stable, how much favorable movement was captured, and whether the result is likely to survive a different market regime.
The Problem With “I Made Money”
Forex traders often compress performance into a single verdict: the account finished the month up or down. That is useful for accounting, but weak for diagnosis. A positive month can come from a durable edge, one oversized outlier, leverage, favorable sequencing, or plain luck. A negative month can come from a broken strategy—or from a statistically ordinary losing cluster inside an otherwise viable process.
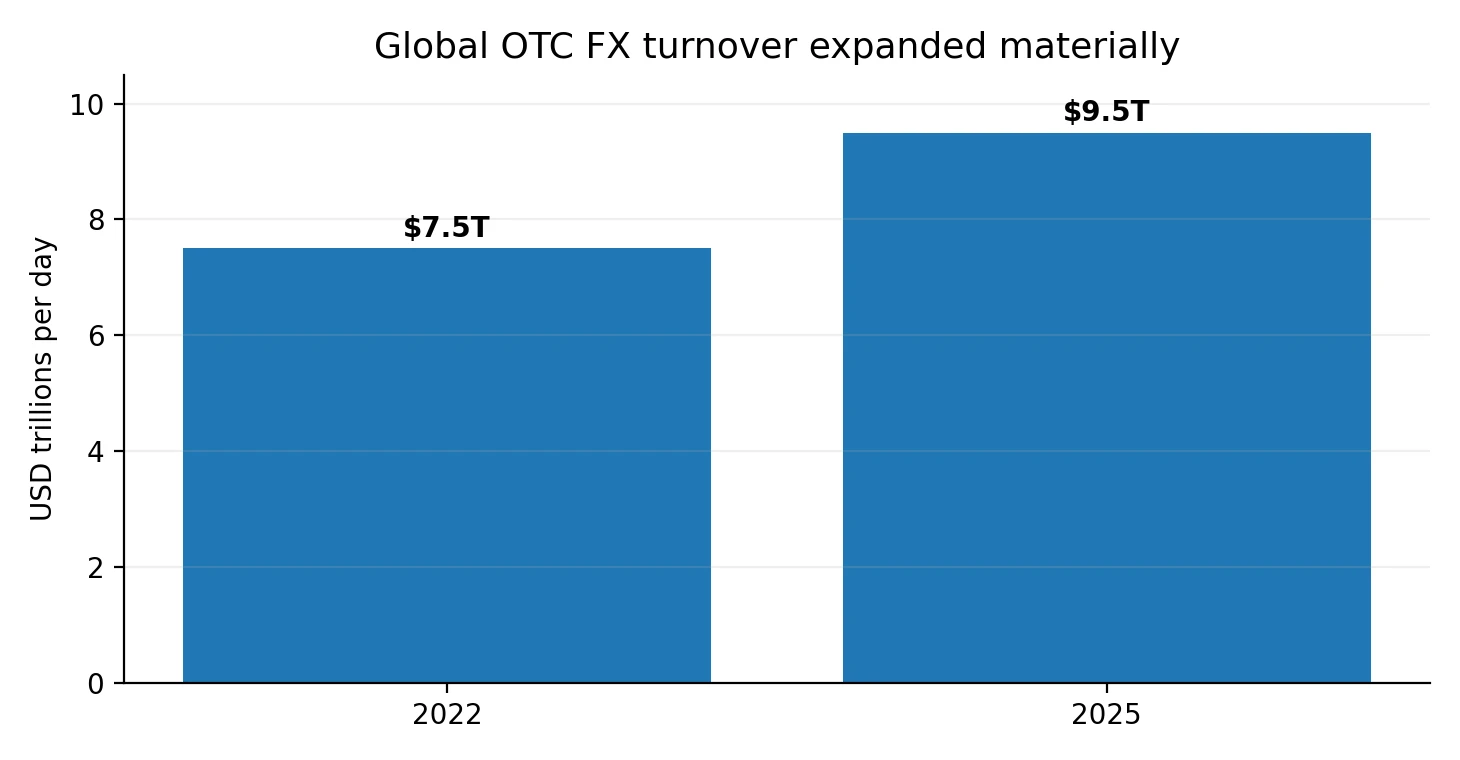
That distinction matters in a market where execution conditions, volatility, liquidity, holding period, and currency exposure can change quickly. The Bank for International Settlements reported that global over-the-counter foreign-exchange turnover averaged about $9.5 trillion per day in April 2025, up more than a quarter from 2022. The scale of the market does not make an individual strategy stable; it means the strategy operates inside a deep, adaptive environment in which the composition of flows and volatility can shift.
Trade performance analytics is therefore the discipline of turning a trade log into evidence. The goal is not to produce more statistics. The goal is to identify which statistics have decision value: whether to keep trading a model, reduce risk, change execution, revise exits, isolate a weak currency pair, or stop trusting an apparently impressive backtest.
Start With R, Not Dollars
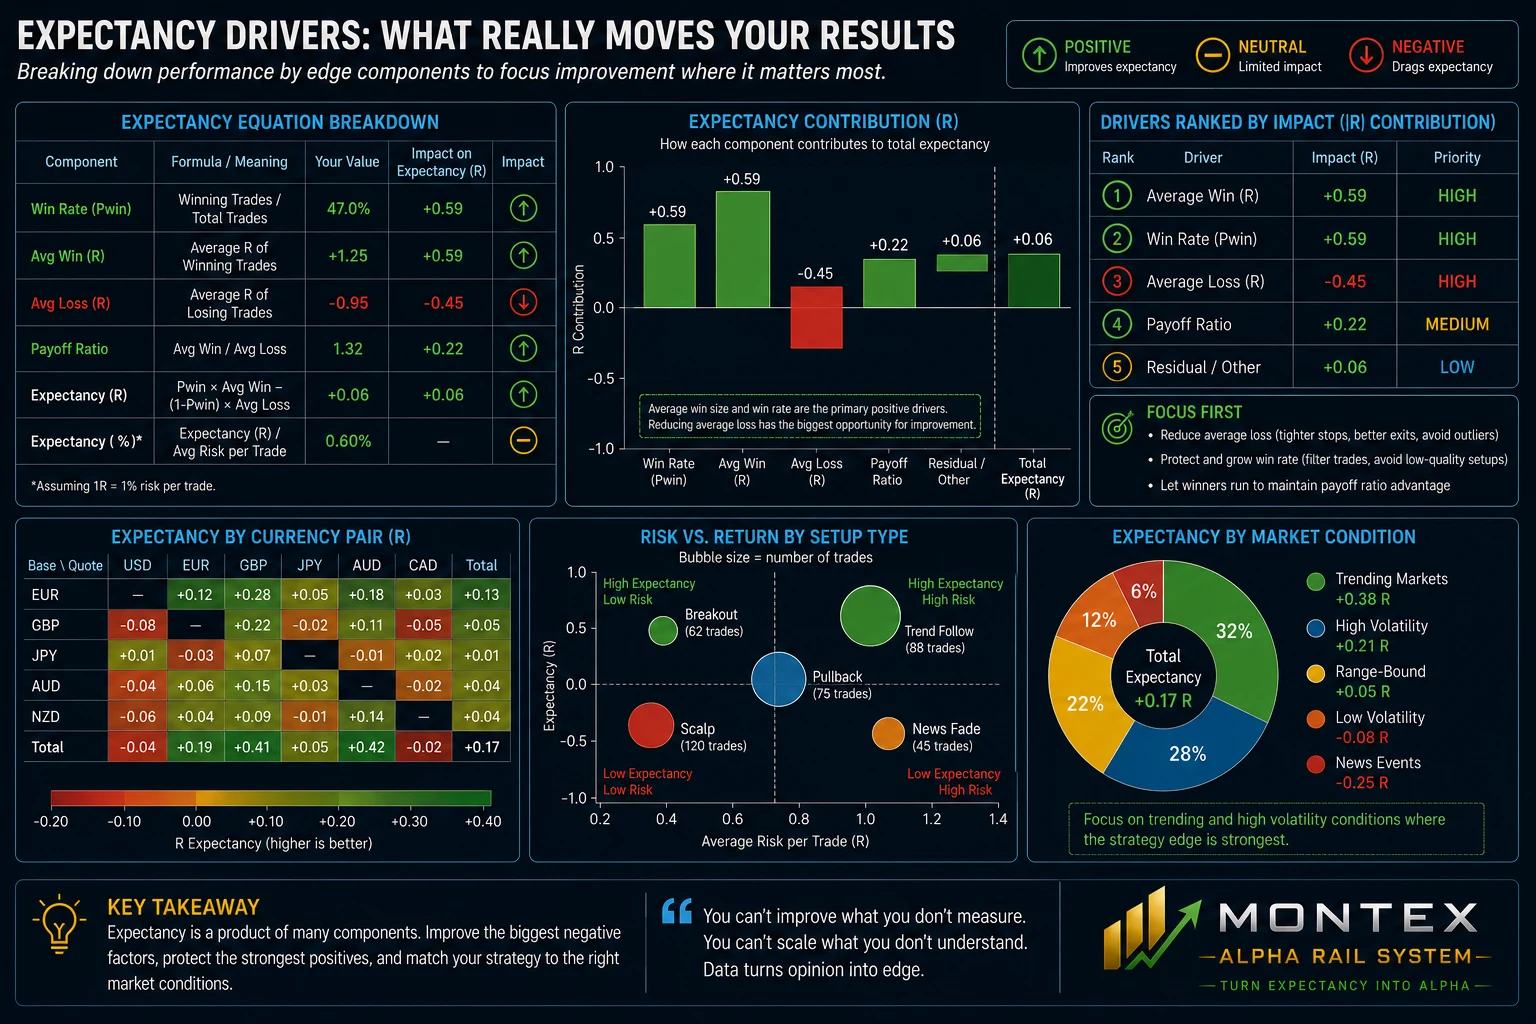
For strategy diagnosis, dollar P&L is contaminated by account size and position sizing. A $600 winner means something very different when the planned initial risk was $100 than when it was $500. Converting every outcome into an R-multiple normalizes trades around the amount initially risked.
R-multiple. If planned initial risk is $200, a $300 gain is +1.5R and a $200 loss is −1.0R. Once trades are expressed in R, results can be compared across pairs, dates, position sizes, and account sizes.
This normalization exposes the payoff structure. Two strategies can both win 50% of their trades but have radically different economics. One may average +1.5R on winners and −1R on losers; the other may average +0.6R and −1R. The first has positive expectancy before costs; the second does not.
| Metric | Formula / meaning | What it diagnoses |
|---|---|---|
| Win rate | Winning trades / total trades | Frequency of positive outcomes; weak in isolation |
| Average win | Mean R of winning trades | Size of rewarded outcomes |
| Average loss | Absolute mean R of losing trades | Loss severity and stop behavior |
| Payoff ratio | Average win / average loss | Reward-to-loss asymmetry |
| Expectancy | P(win) × Avg win − P(loss) × Avg loss | Expected R generated per trade over a sufficiently representative sample |
| Profit factor | Gross profit / gross loss | Total winning magnitude relative to total losing magnitude |
| Median trade | Median R outcome | Typical trade; less distorted by extreme tails |
The Distribution Is the Strategy
A single average hides the structure that produced it. Intermediate and advanced traders should inspect the full payoff distribution: the mass of losses, the density of small wins, the presence of large winners, and the tails. Trend-following systems may tolerate many small losses because a thin right tail carries the edge. Mean-reversion systems can show the opposite shape: frequent modest wins with rare but damaging left-tail events.
This is why win rate should be treated as a descriptive statistic rather than a quality score. A 38% win rate can be excellent if winners are sufficiently large and the losses are tightly bounded. An 80% win rate can be fragile if the strategy periodically gives back many small gains in one loss.
- Look at mean and median together. A large gap can signal that a few outliers are carrying the sample.
- Inspect the left tail. Ask whether the worst losses reflect intended stops, slippage, gaps, news events, or rule violations.
- Separate scratch trades and partial exits. A high count of tiny gains may inflate win rate without materially improving expectancy.
- Segment by branch, setup, currency pair, session, volatility state, and holding time when sample size permits.
Expectancy Is Necessary, but Rolling Expectancy Is More Useful
Lifetime expectancy answers a broad question: what has this trade process produced on average? It does not answer the operational question: what is it producing now? A strategy can retain a positive cumulative expectancy long after its recent behavior has deteriorated.
Rolling windows solve part of that problem. A 20-trade, 50-trade, or time-based window allows the trader to observe whether average R is strengthening, flattening, or turning negative. The correct window depends on trade frequency and the speed at which the strategy experiences different market states. Windows that are too short are noisy; windows that are too long react slowly.
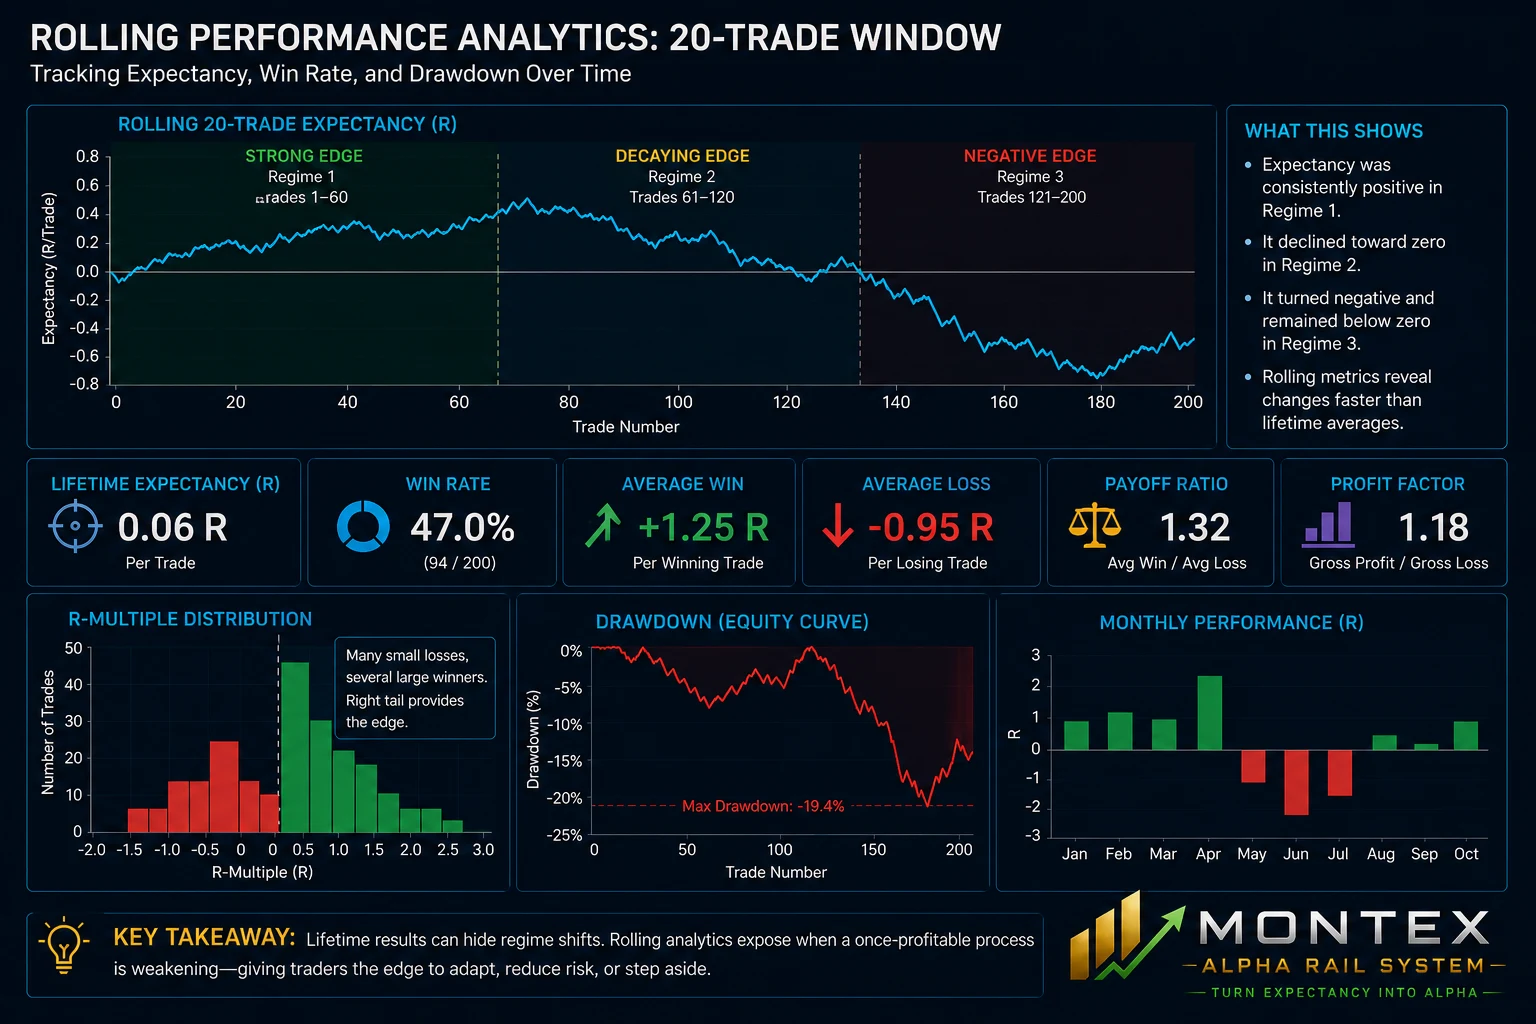
Operational rule. Do not treat one weak rolling window as proof that the edge is dead. Treat repeated deterioration across multiple metrics—expectancy, distribution, drawdown, execution, and regime segmentation—as a stronger warning signal.
Separate Edge From Risk and Leverage
A trader can improve dollar returns simply by taking more risk. That is not the same as improving the strategy. Performance analytics should therefore separate strategy quality from the capital multiplier applied to it.
One practical method is to maintain two views: an R-based strategy record and an account-level equity record. The first estimates trade-process quality. The second shows what happened after position sizing, compounding, concurrent exposure, and costs were applied. If R-expectancy is flat but account growth accelerates only because risk per trade increased, the performance improvement is financial gearing, not edge improvement.
This distinction is particularly important in retail forex because margin and leverage amplify both gains and losses. The CFTC warns that leverage can magnify losses and may require additional funds or forced position closure when markets move against the trader. Performance reports that emphasize return without the risk used to generate it can therefore be seriously misleading.
| Question | Edge view | Capital / risk view |
|---|---|---|
| What is the process producing? | R per trade; distribution; hit rate; payoff | Dollar P&L; return on equity |
| Is the strategy improving? | Rolling expectancy; capture; pair/setup attribution | Risk-adjusted growth |
| Why did P&L jump? | Better outcomes or larger right tail? | Higher risk, more exposure, more concurrency? |
| What can break first? | Edge decay, execution degradation | Drawdown, margin pressure, concentration |
Equity Curves Need a Drawdown Twin
Equity curves are psychologically persuasive because the eye is attracted to slope. The same curve can look acceptable or dangerous depending on the drawdowns required to achieve it. Maximum drawdown measures the deepest peak-to-trough decline in the observed sample; drawdown duration measures how long capital remains below a prior high-water mark.
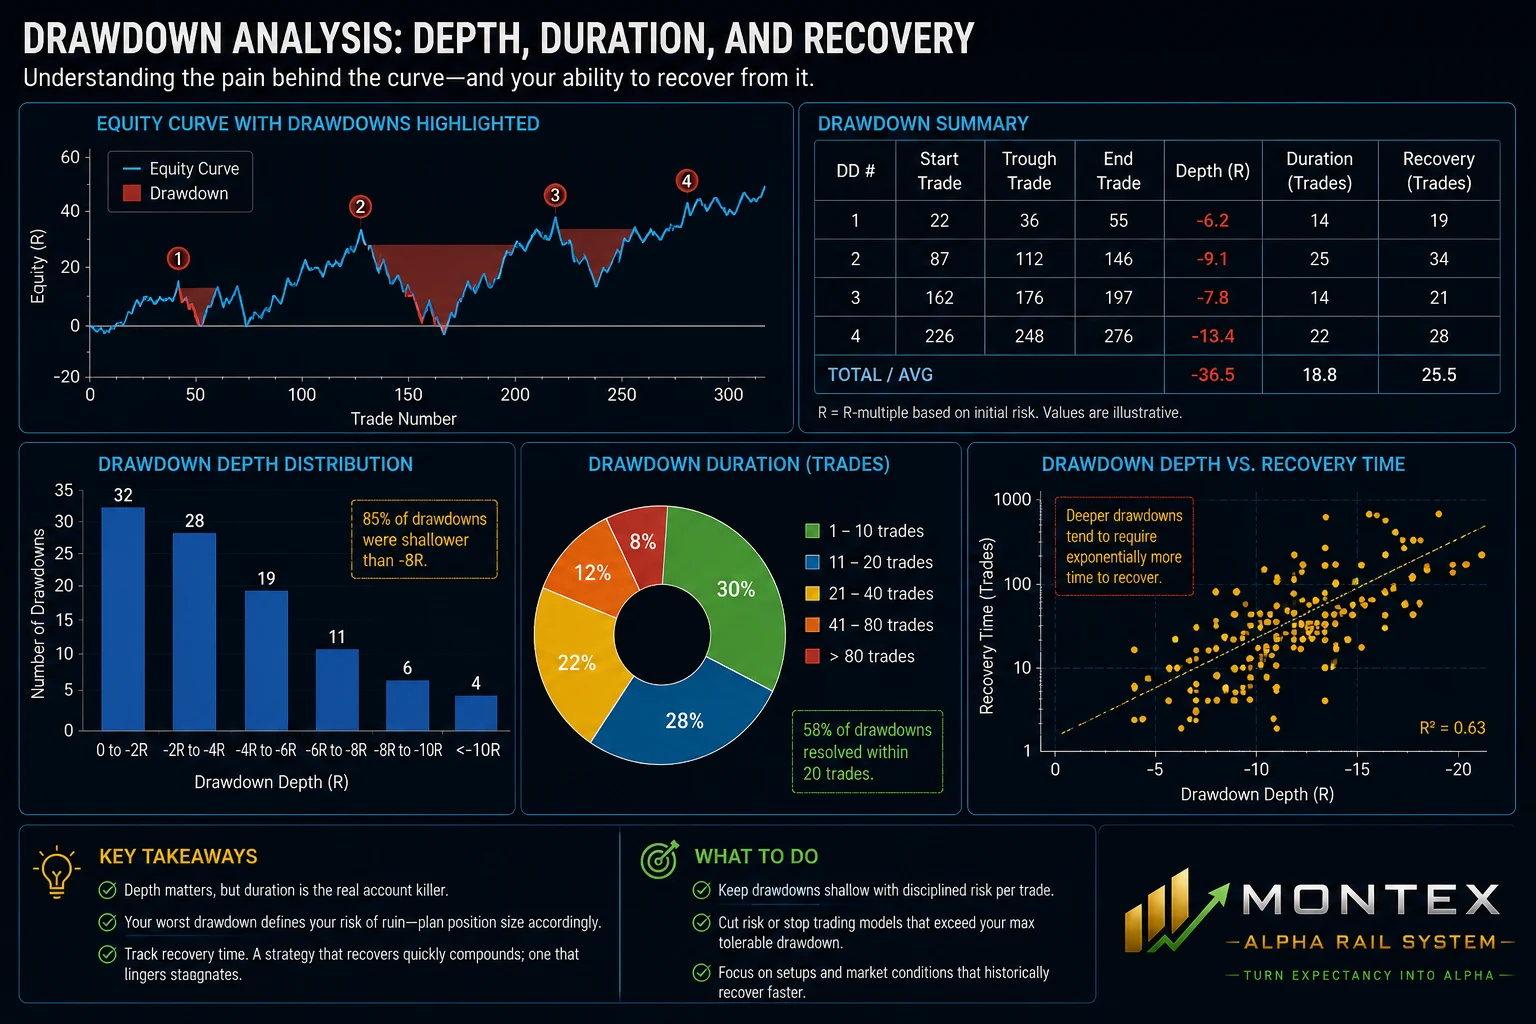
Advanced review goes beyond maximum drawdown. Measure drawdown velocity, duration, recovery time, clustering of losses, and the location of drawdowns by market regime. A 10% decline produced by ten orderly −1R losses has different operational implications from a 10% decline created by slippage, correlated positions, or one uncontrolled event.
The CFA Institute has highlighted the relationship between ex-post Sharpe ratio and maximum drawdown as a useful credibility check in performance measurement. More broadly, the lesson is that no risk-adjusted ratio should be interpreted without the underlying path. Ratios compress information; the path explains it.
MAE and MFE Turn Every Trade Into an Execution Study
Maximum adverse excursion (MAE) is the worst unrealized movement against a position while it is open. Maximum favorable excursion (MFE) is the best unrealized movement in favor of the position. Expressing both in R creates a powerful diagnostic map.
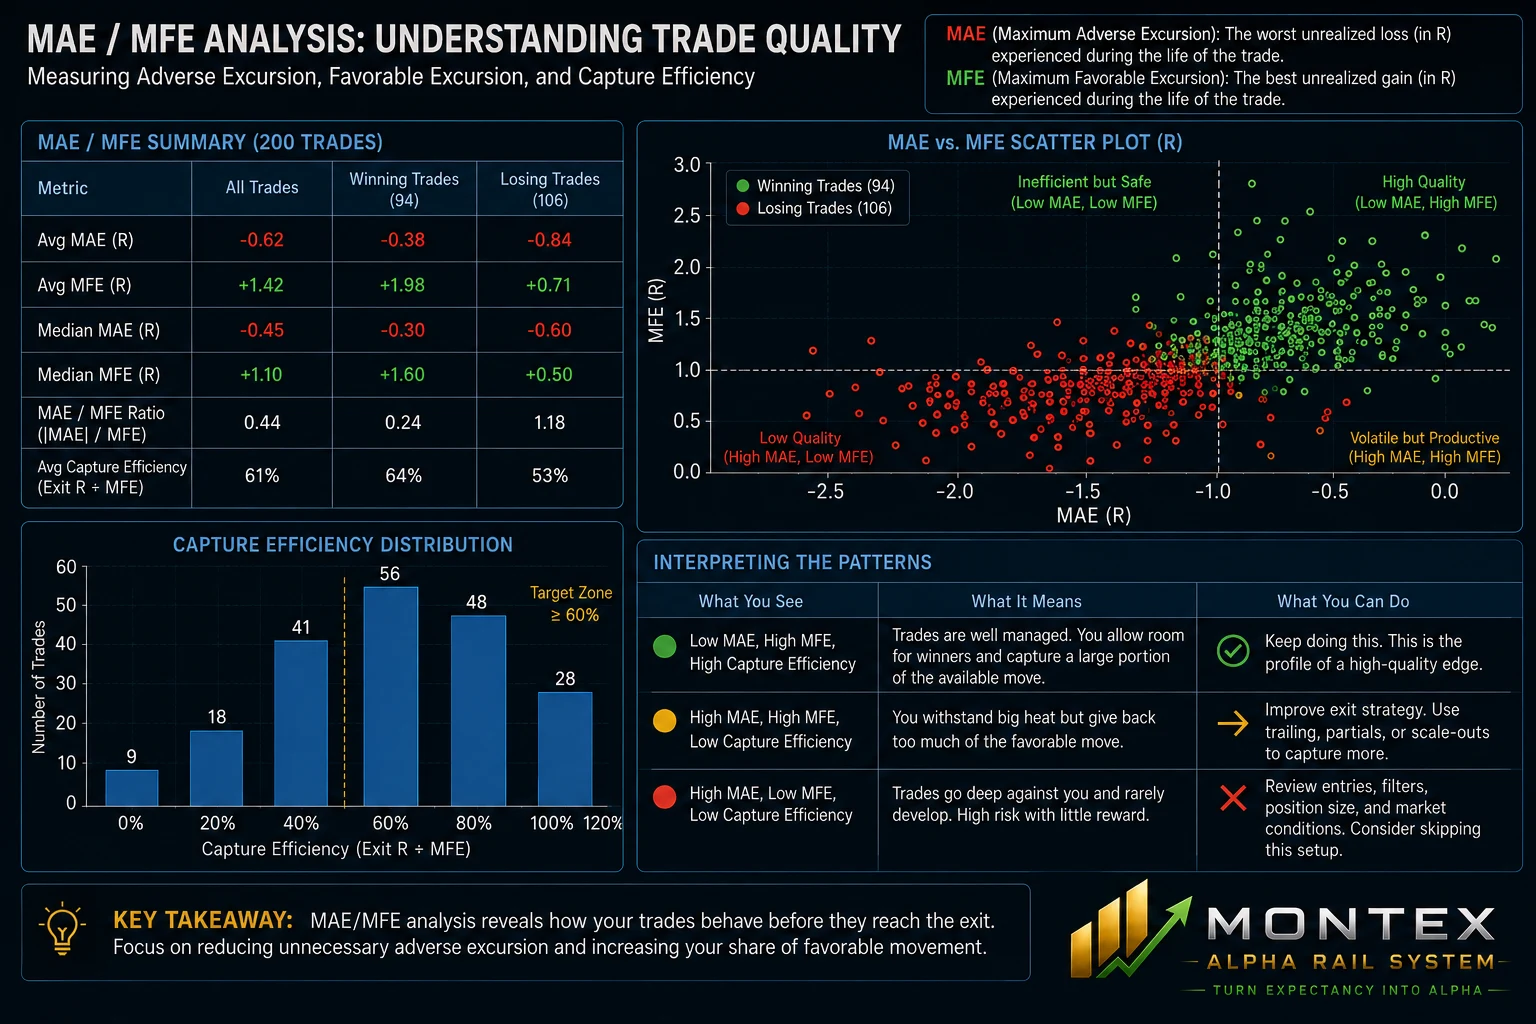
MAE helps answer whether the entry routinely requires too much heat before working. MFE helps answer whether the market offered more profit than the exit captured. A strategy with good final expectancy but repeatedly deep MAE may be difficult to scale. A strategy with strong MFE but modest realized R may have an exit-efficiency problem.
| Pattern | Possible interpretation | Next test |
|---|---|---|
| Low MAE, high MFE | Clean entry with substantial opportunity | Test whether exits capture enough of the move |
| High MAE, high MFE | Volatile entry, eventual payoff | Check stop placement and entry timing |
| Low MAE, low MFE | Stable but low-opportunity trades | Review target economics and setup quality |
| High MAE, low MFE | Poor asymmetry | Investigate entry model, regime filter, or trade selection |
Capture Efficiency: Did You Monetize the Move?
MFE tells you what the market made available. Realized R tells you what the trade actually monetized. Their relationship creates a family of capture metrics. A simple version is realized favorable R divided by MFE for profitable trades. More advanced variants can account for partial exits, trailing stops, and whether the objective is convex tail capture rather than maximum percentage harvest.
Capture efficiency should never be optimized mechanically toward 100%. Exiting at the exact high is not a repeatable objective, and a trend system may intentionally accept giveback to preserve access to larger tails. The useful question is whether the observed giveback is consistent with the strategy’s design or is simply unmanaged leakage.
Example. If a trade reaches +2.0R MFE and closes at +0.8R, it captured 40% of the maximum favorable excursion. That may be unacceptable for a fixed-target strategy but perfectly normal for a trailing model designed to stay exposed to rare large trends. Context determines interpretation.
Costs Must Be Attributed, Not Merely Subtracted
Net performance is what matters economically, but aggregate cost totals do not explain where leakage occurs. In forex, spread, commission, slippage, swap or financing, and execution latency can affect strategies differently. High-turnover or small-target systems are especially sensitive because costs consume a larger fraction of gross edge.
Track costs at the same granularity as performance: by pair, session, setup, order type, broker or venue when applicable, and holding duration. The result may reveal that a strategy is structurally profitable before costs but untradeable in a specific execution environment—or that a weak pair is actually an execution problem rather than a signal problem.
| Cost / friction | Measurement | Diagnostic use |
|---|---|---|
| Spread | Entry spread in pips or R | Pair/session liquidity conditions |
| Commission | Cash and R-equivalent | True break-even expectancy |
| Slippage | Expected price vs. fill price | Execution quality and volatility sensitivity |
| Financing / swap | Overnight carry cost or credit | Holding-period economics |
| Latency / missed fill | Signal-to-execution delay; unfilled orders | Implementation shortfall |
Segment the Record Before You Change the Strategy
The fastest way to destroy useful information is to average together trades generated under materially different conditions. Before changing a rule, decompose the record. Segment only where there is a plausible mechanism and enough observations to support interpretation.
- Currency pair or currency factor: EUR/USD, GBP/USD, JPY exposure, USD-heavy clusters.
- Session and time of day: London, New York, overlap, rollover-sensitive periods.
- Volatility state: expansion, compression, high ATR, low ATR, news-driven periods.
- Setup or branch: breakout, pullback, trend continuation, mean reversion, variant families.
- Trade management: fixed target, partial exit, runner, trailing stop.
- Holding time: minutes, hours, intraday close, overnight.
Attribution turns a general statement such as ‘the strategy is losing’ into a testable statement such as ‘the London-session continuation branch remains positive, while the low-volatility breakout subset has produced negative rolling expectancy and increasing MAE over the last 60 observations.’ The second statement can drive an engineering decision.
Statistical Confidence: Good Numbers Can Still Be Noise
Performance metrics are estimates. They inherit uncertainty from sample size, market non-stationarity, skewed payoffs, serial dependence, and the research process used to select the strategy. A 2.0 Sharpe ratio or strong profit factor from a small, heavily optimized backtest should not be treated the same as similar statistics from a long, untouched out-of-sample record.
Bailey and López de Prado’s Deflated Sharpe Ratio framework addresses two major sources of performance inflation: selection bias from trying many alternatives and non-normal return distributions. Their broader warning is directly relevant to trading-system development: the more configurations you search and the more aggressively you select the winner, the more evidence you need before believing the reported performance.
For a practical forex workflow, keep an audit trail of how many variants were tested, preserve true out-of-sample data, compare live results with simulated expectations, and avoid revising rules every time recent outcomes disappoint. Constant modification can convert the live market into an endless in-sample optimization exercise.
| Evidence level | What it can support | What it cannot support confidently |
|---|---|---|
| Small recent sample | Operational observations; execution anomalies | Stable long-run expectancy claims |
| Long backtest only | Historical behavior under tested assumptions | Future robustness without OOS validation |
| Out-of-sample / walk-forward | Stronger evidence of generalization | Immunity to regime change |
| Live track record | Real implementation behavior | Causality without attribution and controls |
A Professional Trade-Performance Dashboard
A useful dashboard should be compact enough to review routinely but deep enough to reveal structural problems. The following stack is a practical starting point for an intermediate-to-advanced forex operation.
| Layer | Core metrics | Primary question |
|---|---|---|
| Outcome | Net R, net P&L, win rate, avg win/loss, profit factor | What happened? |
| Expectancy | Cumulative and rolling expectancy; median trade | Is the edge positive and stable? |
| Path risk | Max drawdown, duration, recovery, loss clusters | What path did capital endure? |
| Excursion | MAE, MFE, capture efficiency, giveback | Were entries and exits efficient? |
| Attribution | Pair, session, setup, branch, regime, holding time | Where did results come from? |
| Friction | Spread, commission, slippage, financing | How much edge leaked in implementation? |
| Validation | Sample size, OOS status, live-vs-model deviation | How much confidence should we place in the record? |
The Review Sequence: Diagnose Before You Optimize
- Normalize the log into R-multiples and verify that risk calculations are consistent.
- Reconcile gross and net results, including all trading costs and financing.
- Inspect the payoff distribution before reading any single summary ratio.
- Calculate cumulative and rolling expectancy at more than one horizon.
- Review equity and drawdown together, including duration and recovery.
- Inspect MAE/MFE and capture behavior to identify entry and exit inefficiency.
- Attribute performance by pair, session, setup, management branch, and volatility regime.
- Check sample size and research history before treating strong metrics as evidence of durable skill.
- Only then decide whether the correct action is no change, reduced risk, targeted testing, execution improvement, or a rule revision.
What Not to Do
- Do not optimize for win rate if the change damages payoff asymmetry or tail capture.
- Do not increase risk because a short rolling window is strong.
- Do not remove a losing subset solely because it lost recently; determine whether the loss is statistically and structurally meaningful.
- Do not compare strategies on raw dollar profit when position sizes differ.
- Do not treat a backtest Sharpe ratio, profit factor, or CAGR as independent proof of robustness.
- Do not confuse a smooth equity curve with low structural risk; leverage and hidden tail exposure can manufacture smoothness until they do not.
Conclusion: Performance Is a System of Evidence
The mature question is not, ‘Did the strategy make money?’ It is, ‘What combination of edge, risk, path, execution, and market state produced the result—and is that combination repeatable?’
For forex traders, that means moving beyond scorekeeping. Win rate, net profit, and a single equity curve are the beginning of the review, not the end. R-multiple distributions reveal payoff structure. Rolling expectancy detects drift. Drawdown analysis exposes path risk. MAE/MFE and capture metrics diagnose trade management. Attribution identifies where strength and weakness actually live. Validation disciplines how much confidence the trader is allowed to place in all of the above.
When those layers agree, performance analytics becomes more than reporting. It becomes a governance mechanism: a way to distinguish normal variance from structural deterioration, execution leakage from signal failure, and genuine improvement from leverage or luck. That is the level at which a trading record becomes decision-grade evidence.
Final takeaway. The objective of performance analytics is not to find the most flattering metric. It is to build a measurement stack in which no single metric is powerful enough to fool you.
Key Terms
| Term | Definition |
|---|---|
| R-multiple | Trade outcome expressed as a multiple of planned initial risk. |
| Expectancy | Average expected R per trade, commonly expressed from win probability and average win/loss magnitude. |
| Maximum drawdown | Largest observed peak-to-trough decline over the measurement period. |
| MAE | Maximum adverse excursion while a trade is open. |
| MFE | Maximum favorable excursion while a trade is open. |
| Capture efficiency | A measure of realized favorable outcome relative to favorable movement made available by the market. |
| Rolling metric | A statistic recalculated over a moving window to reveal recent change or drift. |
| Performance attribution | Decomposition of results by source, such as pair, setup, regime, branch, or execution condition. |
Sources and Further Reading
- Bank for International Settlements. 2025 Triennial Central Bank Survey — OTC Foreign Exchange Turnover in April 2025
- Bank for International Settlements. 2025 Triennial Survey — Publication and Final-Results Hub
- Bailey, David H. & López de Prado, Marcos. The Deflated Sharpe Ratio: Correcting for Selection Bias, Backtest Overfitting and Non-Normality
- CFA Institute Research and Policy Center. An Upper Bound for an Ex Post Sharpe Ratio with Application in Performance Measurement
- U.S. Commodity Futures Trading Commission. Eight Things You Should Know Before Trading Forex
Editorial note. Figures 2–5 use synthetic data created solely to explain analytical concepts. They are not backtested or live performance results for Montex AlphaRail Systems and should not be interpreted as return claims. Figure 1 uses rounded BIS market-turnover data.
Disclaimer. This article is for educational and research purposes only and does not constitute investment advice, a recommendation, or a representation of future trading performance. Forex trading involves substantial risk, including the risk of loss amplified by leverage.