

A practical guide for understanding how Forex trends form, persist, weaken, and fail across timeframes and trading sessions.
A trend looks obvious only after it has already happened. In real time, the trader sees overlapping candles, sudden pullbacks, session changes, economic releases, false breaks, and several timeframes telling different stories. That is why trend analysis is not simply the act of drawing a diagonal line beneath price. It is the disciplined process of deciding whether directional movement is structurally real, whether it still has room to continue, and whether the price being offered is worth the risk required to participate.
In Forex, that judgment is especially demanding. Currencies trade around the clock, each pair expresses the relative strength of two economies, and liquidity migrates from Asia to London to New York. A move can be a clean trend on a five-minute chart, a routine pullback on the one-hour chart, and meaningless noise inside a daily range. The goal of this guide is to give readers at every level a common language for separating those conditions.
Core principle. Trend analysis should answer three questions in order: What direction currently holds structural control? How healthy is that control? Is the location and timing good enough to justify risk? Direction alone is never a complete trade decision.
A Trend Is a Condition, Not a Line
The beginner definition of an uptrend is “higher highs and higher lows,” while a downtrend is “lower highs and lower lows.” That definition is useful, but incomplete. Markets rarely print perfect staircases. A valid trend may contain deep retracements, failed continuation attempts, temporary ranges, or a sharp countertrend move caused by news. Conversely, a chart may print two higher highs without developing a durable trend at all.
A more useful definition is this: a trend is a persistent directional imbalance in which one side of the market repeatedly proves capable of moving price farther than the opposing side can reverse it. In an uptrend, buyers do more than lift price once. They defend pullbacks, reclaim temporary weakness, and produce new expansion. In a downtrend, sellers repeatedly absorb rebounds and force acceptance at lower prices.
This distinction matters because it moves the trader away from visual pattern matching and toward evidence. The question is not, “Can I draw a trendline?” The question is, “Which side continues to win the sequence of tests that matters on my decision timeframe?”
The Six Dimensions of Trend Quality
A robust trend assessment combines six dimensions. No single dimension has veto power in every situation, but together they prevent the common mistake of labeling any fast move a high-quality trend.
| Dimension | What it asks | Evidence to observe |
|---|---|---|
| Direction | The side currently producing net progress. | Swing sequence, closes, acceptance above or below key structure |
| Structure | Whether directional control survives meaningful tests. | Higher lows/lower highs, defended zones, break-and-hold behavior |
| Momentum | The speed and persistence of directional movement. | Impulse length, candle overlap, follow-through, rate of change |
| Volatility | The distance price can travel and the cost of being wrong. | ATR, range expansion, stop distance, compression-to-expansion shifts |
| Participation | Whether movement occurs when sufficient liquidity is available. | Session timing, spread behavior, reaction to major market opens |
| Maturity | Where the move sits in its life cycle. | Number of extensions, pullback quality, failed pushes, late acceleration |
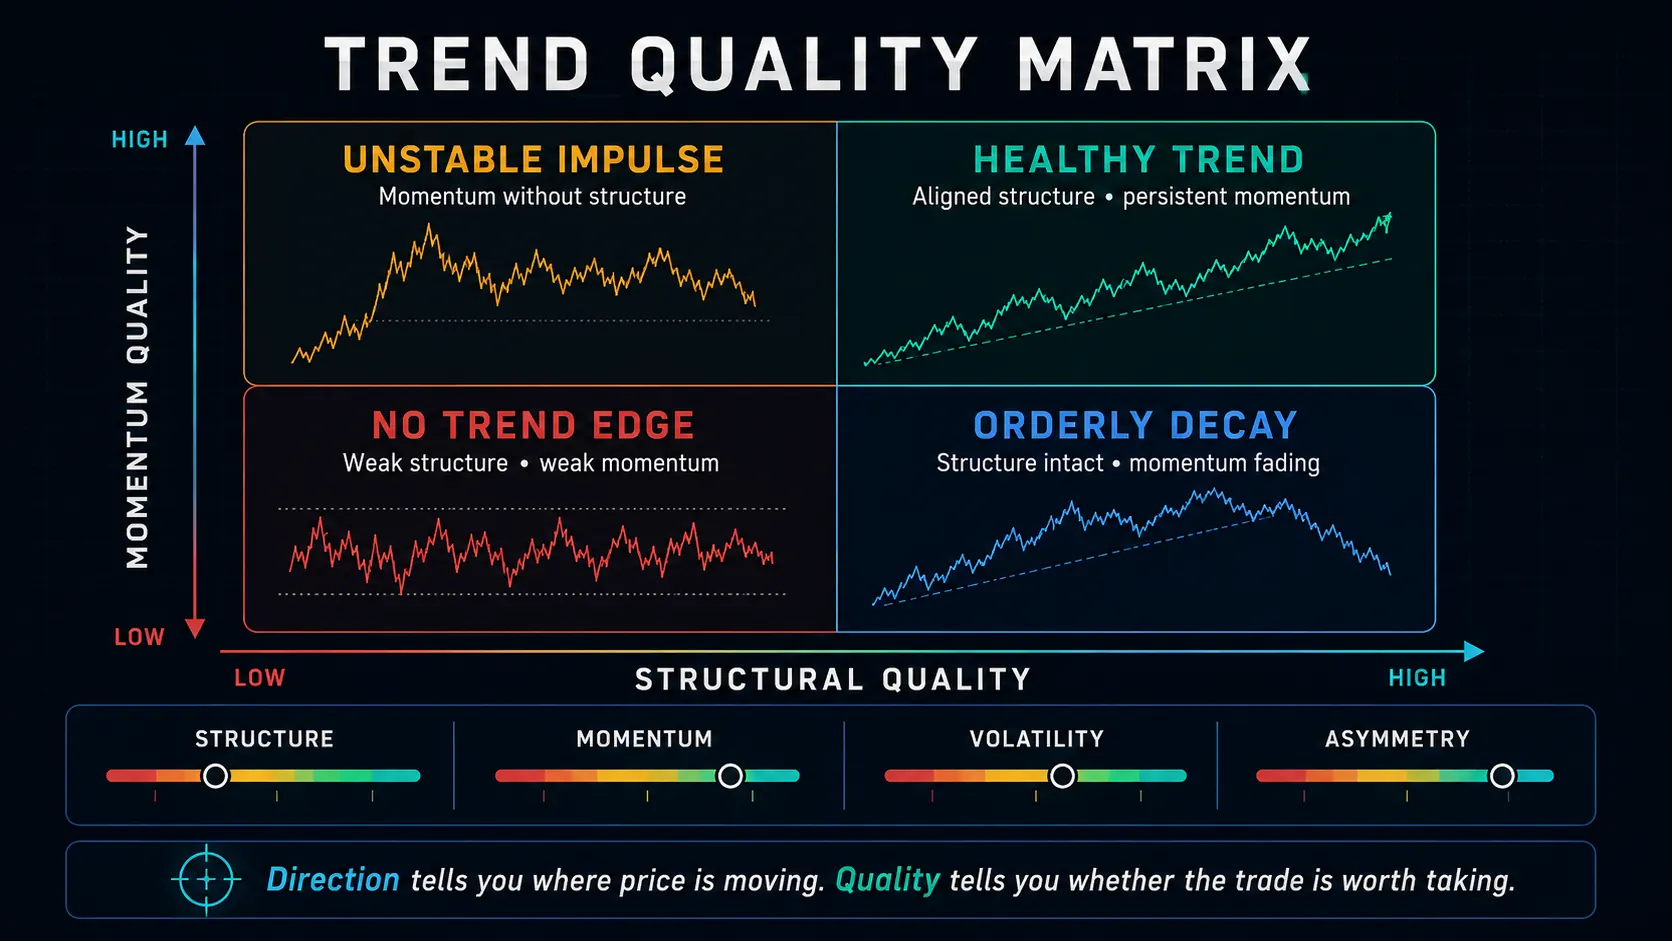
Direction and structure
Direction describes where price is moving; structure describes whether that movement has earned authority. A one-candle surge can establish direction temporarily, but only the market's response afterward reveals whether the move has structural support. If price breaks a prior swing high, holds above it, forms a controlled pullback, and expands again, the evidence is stronger than a breakout that immediately falls back into the old range.
Momentum and volatility
Momentum and volatility are related but not identical. Momentum describes directional efficiency. Volatility describes the size of movement in either direction. A market can be highly volatile but directionless, whipping through both sides of a range. It can also trend with modest volatility through a steady sequence of small directional advances. Traders who confuse volatility with trend strength often enter the loudest part of a move just as its reward-to-risk deteriorates.
Participation and maturity
Forex trends are shaped by when liquidity enters the market. A breakout during a thin transition period may lack the participation necessary to hold. The same structural break during the London open, with broad follow-through across related pairs, carries different information. Maturity then asks whether the move is early, established, or late. A strong trend can still be a poor new trade if most of its available movement has already been consumed.
Trend Life Cycle: Early, Established, Mature, and Failing
Trends do not switch from “off” to “on” and remain unchanged. They develop through a life cycle. Understanding that life cycle reduces two expensive behaviors: entering before confirmation and chasing after the favorable asymmetry has disappeared.
| Phase | Typical evidence | Trading implication |
|---|---|---|
| Early transition | Old range or trend loses control; first meaningful break appears. | High uncertainty, attractive location, greater false-break risk. |
| Emerging trend | Break holds; first controlled pullback and renewed expansion occur. | Often the best balance between confirmation and remaining runway. |
| Established trend | Multiple impulses and defended pullbacks confirm control. | Higher confidence, but entry quality matters increasingly. |
| Mature trend | Extensions shorten, pullbacks deepen, or acceleration becomes excessive. | Continuation remains possible; fresh entries face poorer asymmetry. |
| Failure/transition | Key defense breaks and the market accepts beyond opposing structure. | Stop treating the old trend as the default; reassess state. |
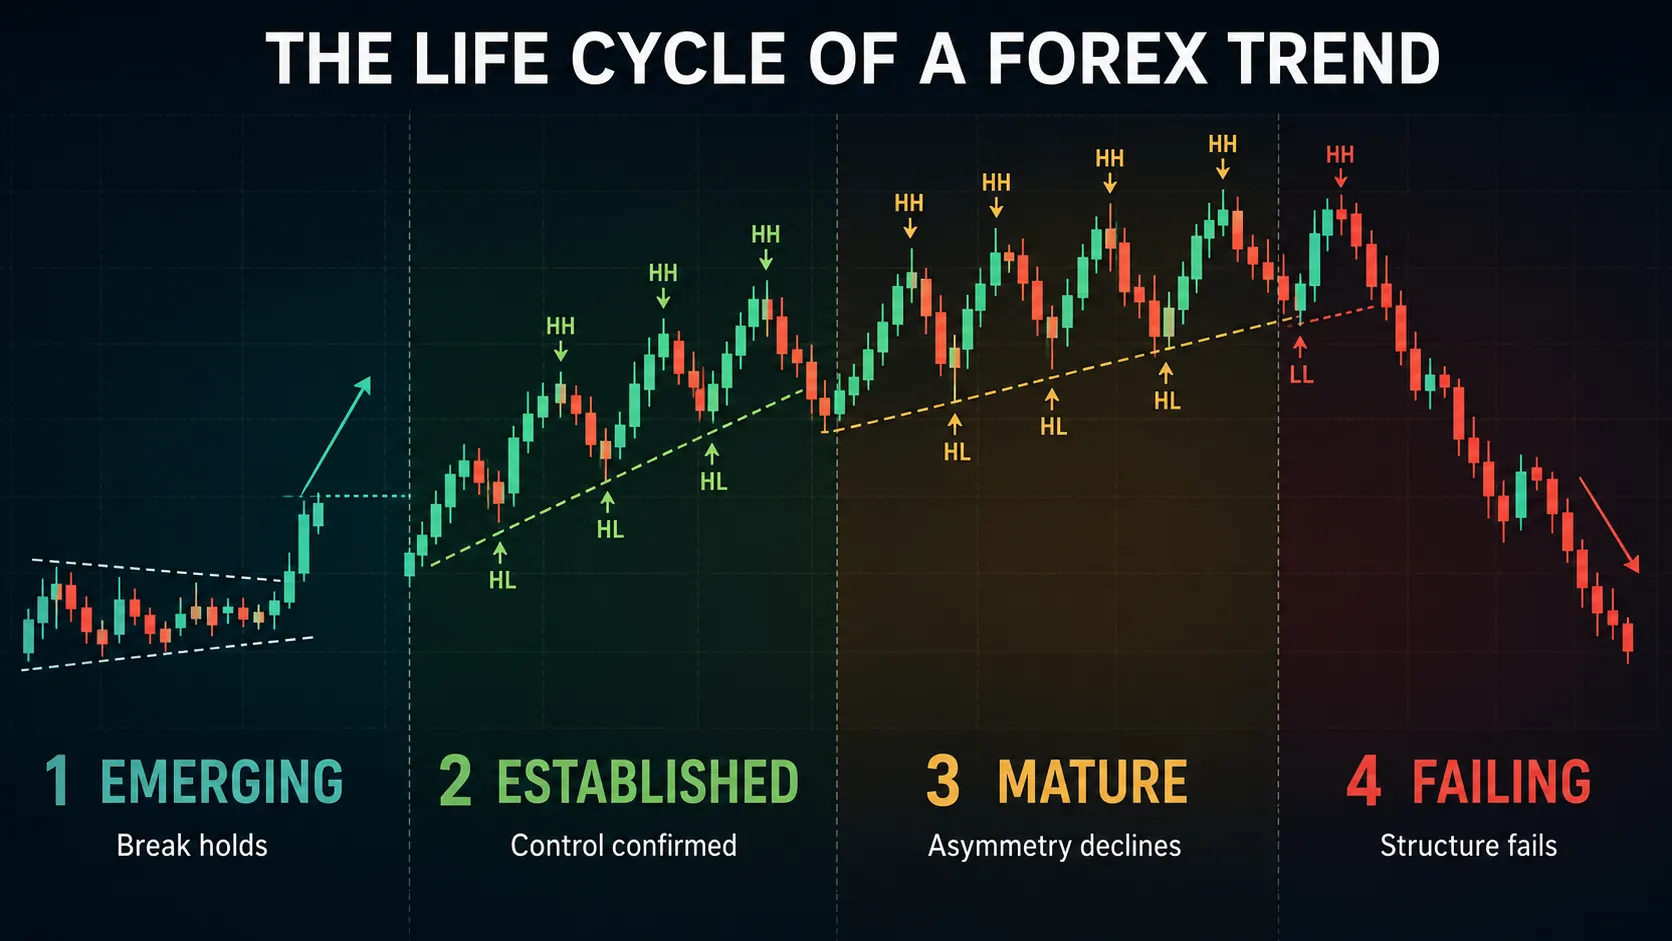
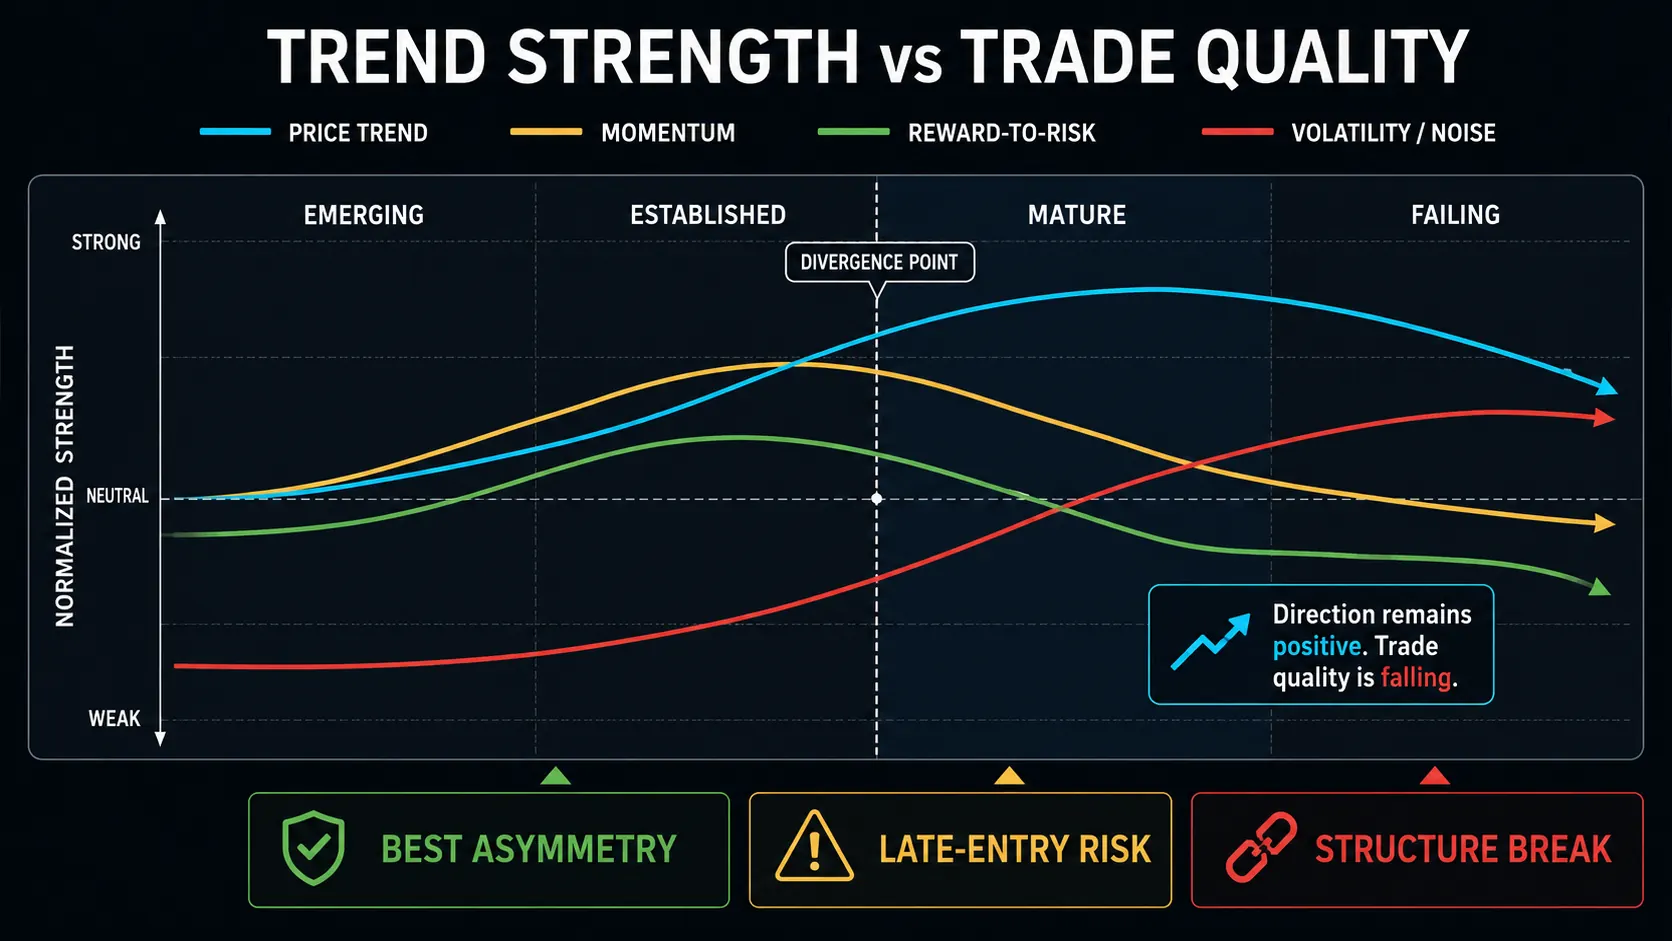
The early phase offers the best price but the weakest proof. The established phase offers stronger proof but often a worse price. Trend trading is therefore a negotiation between confirmation and location. There is no magical entry that maximizes both. The trader must decide what evidence is required before risking capital and what price becomes too expensive, even if the directional thesis remains correct.
Maturity deserves special attention. Late trends often look visually strongest because candles expand, headlines align, and recent winners create confidence. Yet late acceleration may represent exhaustion, stop-driven movement, or the final rush of participation. Strength of appearance and quality of opportunity are not the same thing.
A hard truth about chasing. If the stop must sit much farther away while the nearest logical target remains unchanged, the trend may still be valid but the trade has become inferior. Never use directional confidence to excuse damaged reward-to-risk.
Multi-Timeframe Authority: One Pair, Several Truths
Every trend statement is incomplete without a timeframe. EUR/USD can trend upward on the five-minute chart while declining on the daily chart. Neither observation is wrong. They describe different layers of market behavior. The practical challenge is deciding which layer has authority over the trade being considered.
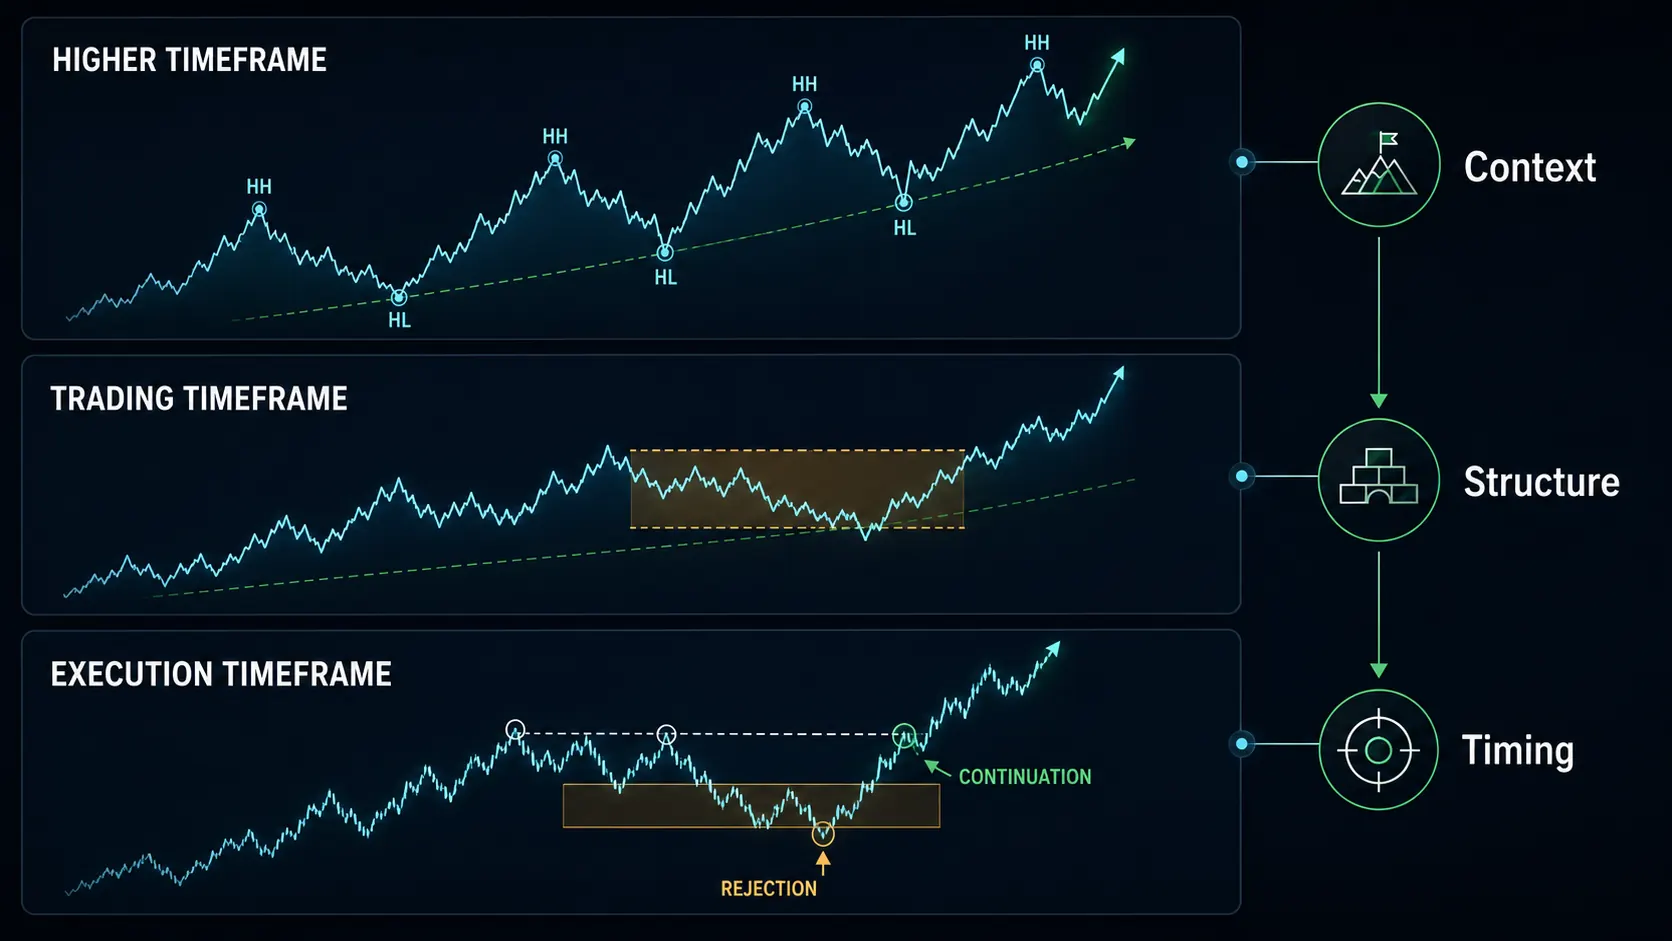
A useful three-layer model separates context, decision, and execution. The context timeframe identifies the dominant environment and major structural boundaries. The decision timeframe defines the setup and the trend state that justifies the trade. The execution timeframe refines timing and risk placement. Problems arise when a trader allows the smallest timeframe to overrule the larger structure merely because it displays more detail.
| Layer | Primary question | Common examples | Use it for |
|---|---|---|---|
| Context | Where is the pair within the larger auction? | Daily / 4-hour | Major trend, range boundaries, macro swing structure |
| Decision | What condition authorizes the trade? | 1-hour / 15-minute | Trend phase, pullback quality, continuation evidence |
| Execution | Where can risk be defined efficiently? | 5-minute / 1-minute | Trigger, invalidation point, spread and entry timing |
Alignment is not always required. A skilled trader may trade a lower-timeframe reversal inside a higher-timeframe range, or a tactical pullback against the daily trend. But the trade must be named honestly. A countertrend scalp should not be managed as though it has the authority and runway of a higher-timeframe continuation. Naming the trade correctly determines the appropriate target, holding time, and tolerance for adverse movement.
Forex Sessions Change the Meaning of Trend Evidence
Forex is decentralized and trades continuously during the business week, but liquidity is not evenly distributed. Session transitions can change volatility, spreads, participation, and the probability that a breakout receives follow-through. A structure that forms during Asia may be tested or rejected when London liquidity arrives. A London trend may extend, consolidate, or reverse as New York joins and U.S. data enters the market.
This does not mean one session is universally better. It means the evidence must be read in context. Asian-session ranges can provide clean reference boundaries. London frequently introduces expansion in European currencies. The London–New York overlap can deepen participation but also increase event risk. Late New York may lose momentum as liquidity falls. Pair selection matters too: activity patterns for EUR/GBP, USD/JPY, and AUD/USD are not interchangeable.
| Session context | Common role | Primary caution |
|---|---|---|
| Asia | Range formation, regional flows, quieter conditions in many European pairs | Mistaking low-liquidity drift for durable trend control |
| London open | Expansion, repricing, tests of Asian boundaries | Chasing the first burst before acceptance is established |
| London–New York overlap | Deep liquidity, U.S. catalysts, continuation or sharp repricing | Ignoring news risk and correlated USD exposure |
| Late New York | Position adjustment, declining participation | Expecting early-session follow-through in fading liquidity |
A trend that persists across a session handoff carries more information than a move that exists only inside one thin window. Cross-session continuity shows that new participants accepted the directional auction rather than immediately fading it. Still, continuity should be measured through price behavior — holding structure, controlled retracement, and renewed progress — not assumed from the clock alone.
Trend, Range, or Transition?
Many losses attributed to “bad trend entries” are actually state-classification errors. The trader sees a directional leg inside a range and labels it a trend. Or the trader recognizes that a former trend has weakened but continues to buy or sell every pullback because the old narrative remains emotionally convenient.
A trend produces net progress. A range repeatedly rejects progress and returns price toward an accepted center. A transition is the unstable middle ground in which the old condition is losing authority but a new condition has not yet proven itself. Transition is not a failure of analysis; it is a legitimate market state. Sometimes the best decision is to reduce exposure or wait for the next structural test.
| State | Defining behavior | Practical response |
|---|---|---|
| Trend | Directional swings make and hold net progress. | Continuation entries, pullback participation, managed runners |
| Range | Breaks fail; price rotates between boundaries. | Boundary trades, smaller expectations, avoid mid-range chasing |
| Transition | Old structure weakens; new control is unconfirmed. | Wait, reduce size, demand stronger confirmation |
What Indicators Can — and Cannot — Confirm
Moving averages, ADX, MACD, RSI, and ATR can organize information, but none can rescue a poor market reading. A moving average can show slope and smooth noise; it cannot tell you whether the next pullback will hold. ADX can describe directional strength without specifying direction. RSI can remain overbought during a healthy uptrend. ATR measures movement, not bullishness or bearishness.
The correct role of an indicator is compression: it should summarize a useful property of price faster or more consistently than the eye alone. The incorrect role is authority substitution: allowing a calculated line to override obvious structural failure. Indicators should support a decision framework, not become a collection of votes. Five indicators derived from the same closing prices are not five independent pieces of evidence.
Avoid redundant confluence. If several tools measure the same underlying feature — recent price momentum, for example — their agreement can create false confidence. Strong analysis combines different evidence families: structure, location, volatility, session participation, and risk asymmetry.
Reading Pullbacks Without Predicting Every Turn
The pullback is where trend theory meets execution. A shallow pullback suggests strong directional pressure but may offer little room for an efficient entry. A deep pullback can improve entry price but may also signal weakening control. The task is not to predict the exact turning candle. It is to evaluate whether the opposing move behaves like temporary correction or genuine structural takeover.
A constructive pullback often displays several of the following qualities:
- It retraces more slowly or less efficiently than the prior impulse.
- Candle overlap increases and opposing momentum loses persistence.
- Price respects a meaningful structural area rather than an arbitrary line.
- The pullback does not decisively invalidate the swing that defines the trend.
- Directional follow-through returns after the test, ideally during a liquid period.
- The invalidation point remains close enough to preserve acceptable reward-to-risk.
No item guarantees success. The value comes from combining evidence and defining what would prove the thesis wrong. A trend entry without a clear invalidation condition is not analysis; it is directional hope.
The Most Common Trend-Analysis Traps
| Trap | What goes wrong | Corrective practice |
|---|---|---|
| Recency bias | The latest impulse dominates judgment. | Zoom out and identify the structure that existed before the impulse. |
| Line worship | A trendline break is treated as a full reversal. | Require structural acceptance, not merely a pierced diagonal. |
| Chasing expansion | Fast candles are mistaken for safe opportunity. | Recalculate stop distance, remaining runway, and event risk. |
| Timeframe shopping | The trader changes charts until one supports the desired trade. | Define context, decision, and execution timeframes before analysis. |
| Indicator voting | Several correlated tools create artificial certainty. | Use distinct evidence families and prioritize structure. |
| Narrative persistence | An old trend remains the default after its key defense fails. | State the specific condition that removes trend authority. |
Trend Analysis Must End in Risk Architecture
Correct direction is not enough. A trader can identify a genuine trend and still lose money through poor sizing, late entry, correlated exposure, or an exit plan that does not fit the trend's maturity. Analysis becomes operational only when it determines how much risk is justified, where the thesis fails, and how the position will be managed if price advances.
Stop distance should reflect market structure and volatility, not the amount the trader wishes to lose. Position size should then be calculated from that stop. This order matters. Choosing a large position first and forcing a tight stop afterward creates the illusion of precision while increasing random stop-outs. ATR can help normalize distance across pairs and volatility regimes, but it should be combined with a logical structural invalidation point.
Portfolio context is equally important. Four USD-directional positions can behave like one concentrated macro bet. If EUR/USD, GBP/USD, AUD/USD, and gold all express the same dollar view, nominal trade count understates real exposure. Trend confidence does not eliminate correlation risk; it can make the trader ignore it.
A Practical Trend-Analysis Workflow
The following workflow is intentionally simple enough for a developing trader and rigorous enough to support advanced refinement. The objective is consistency: analyze the same questions in the same order before adding discretion.
- Define the pair, session, holding horizon, and decision timeframe before opening multiple charts.
- Mark higher-timeframe swing structure, major range boundaries, and obvious event-driven dislocations.
- Classify the current state as trend, range, or transition. If uncertain, record the uncertainty rather than forcing a label.
- Identify the trend phase: early transition, emerging, established, mature, or failing.
- Evaluate direction, structure, momentum, volatility, participation, and maturity as separate dimensions.
- Locate the nearest meaningful invalidation point and estimate the realistic remaining runway.
- Check session timing, scheduled catalysts, spread conditions, and correlated exposure.
- Choose the entry and management logic that fits the trend phase; do not give a late entry an early-trend target assumption.
- Size from predefined risk authority and actual stop distance. Reduce or reject the trade if the geometry is poor.
- After the trade, record whether the trend classification, entry location, and management logic were correct independently of profit or loss.
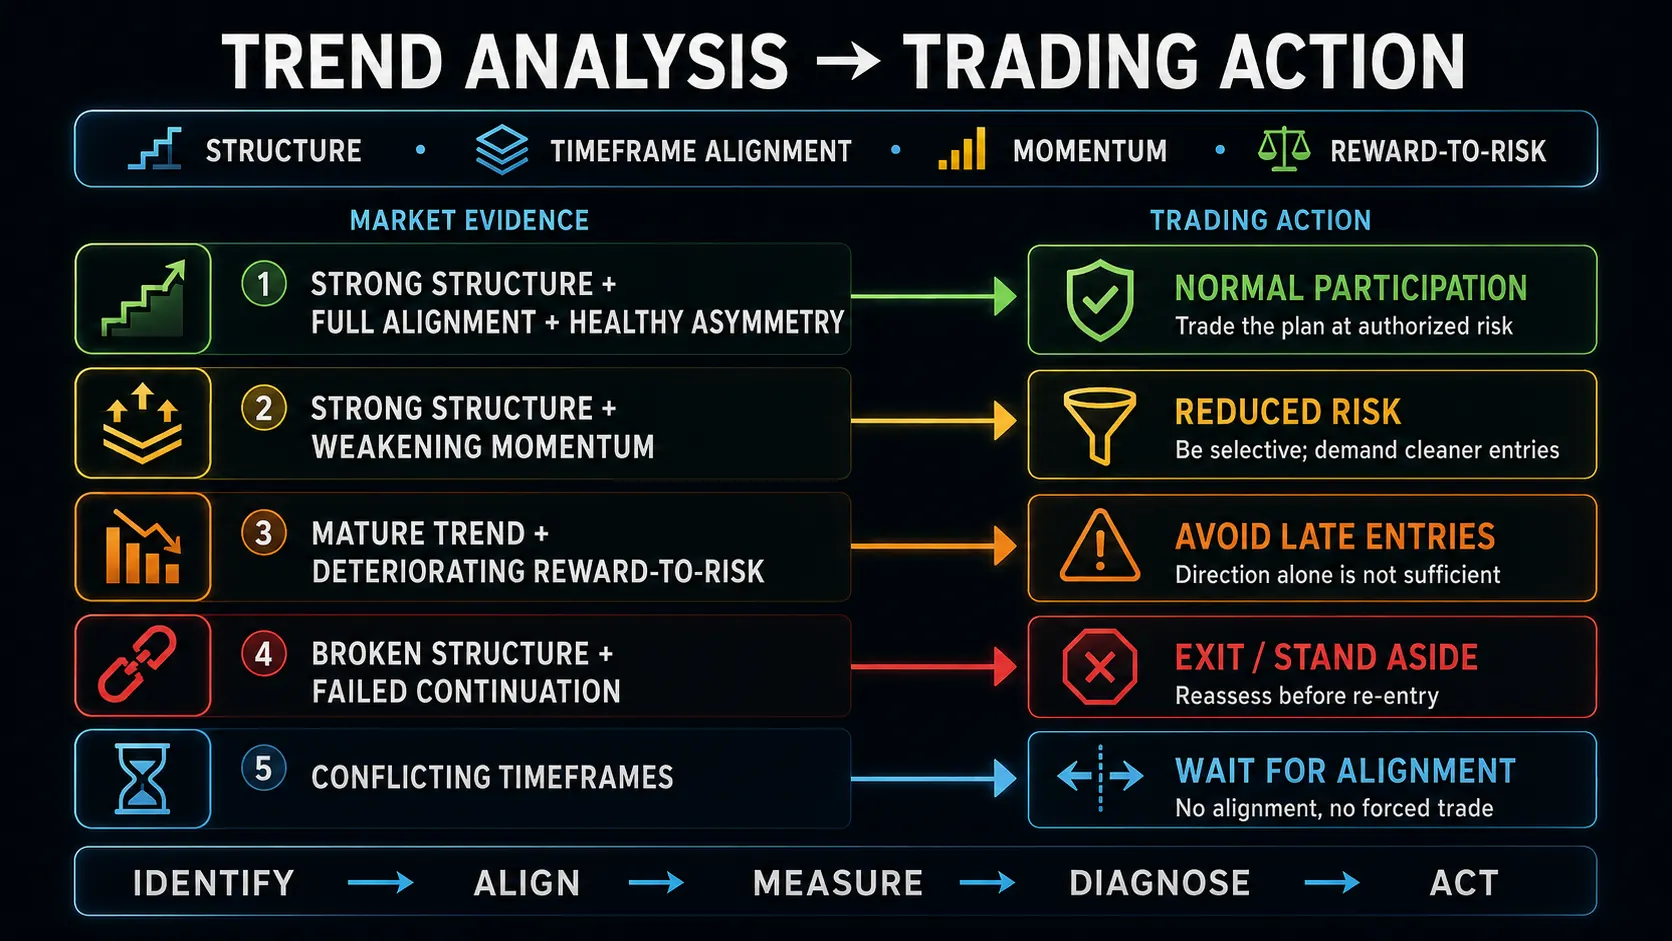
The professional review question. Do not ask only, “Did the trade win?” Ask, “Was the market state classified correctly, was risk appropriate for the evidence, and did the management logic fit the trend phase?” A losing trade can be well executed; a winning chase can be a serious process failure.
A MARS-Inspired View: Trends Grant Opportunity, Not Authority
Within a governed discretionary-quant framework such as the Montex AlphaRail System, market analysis is an input — not the final authority. A strong trend may improve opportunity quality, but account state, drawdown pressure, recent execution quality, and risk permissions still determine how much capital can be deployed. This separation is crucial because traders are most tempted to override controls when a chart looks unusually convincing.
The deeper principle is that conviction and capital authority belong to different layers. Trend analysis estimates opportunity. Risk governance decides exposure. Performance analytics later determine whether the trader is converting the identified opportunity into expectancy efficiently. When those layers are separated, discretion remains useful without becoming unlimited.
This also creates a better learning loop. Instead of judging trend analysis by a handful of outcomes, the trader can study classification accuracy, continuation rates, adverse and favorable excursion, capture efficiency, session effects, and performance by trend phase. Over time, “I trade trends well” becomes a testable statement rather than an identity claim.
Final Takeaway: Read the Auction, Then Respect the Price
A Forex trend is not merely a sequence of candles leaning in one direction. It is a temporary condition of directional control expressed through structure, momentum, volatility, participation, and time. The trader's job is to determine whether that control is real, whether it remains healthy, and whether the current location offers enough asymmetry to justify risk.
For beginners, the most important improvement is to stop treating every fast move as a trend. For intermediate traders, the priority is separating timeframe roles and trend phases. For advanced traders, the edge comes from measuring how trend state interacts with execution quality, portfolio exposure, and risk-adjusted outcomes. At every level, the same discipline applies: classify first, locate second, size third, and review afterward.
The market will always make past trends look cleaner than they were in real time. Your advantage does not come from perfect prediction. It comes from using a repeatable framework that keeps uncertainty visible, demands structural proof, and refuses to pay any price simply because direction looks obvious.
Bottom line. The best trend traders are not the people who see direction first. They are the people who distinguish direction from opportunity, opportunity from permission, and a good thesis from a good trade.
Quick Reference: The 60-Second Trend Check
| Check | Question |
|---|---|
| State | Trend, range, or transition? |
| Authority | Which timeframe defines the trade? |
| Phase | Emerging, established, mature, or failing? |
| Structure | What level must hold for the thesis to remain valid? |
| Quality | Are momentum and pullback behavior directionally efficient? |
| Context | Which session and catalyst environment am I trading? |
| Geometry | Does stop distance leave enough realistic runway? |
| Exposure | What correlated positions make this risk larger than it appears? |
| Permission | Does current risk authority permit this size? |
| Review | What will I record regardless of the outcome? |