
Skip to content

MARS Overview · What Problems MARS Solves

Six failures that destroy workable trading methods.

Failure patterns addressed

6

SDE structural metrics

5

Monte Carlo comparison paths

50K

How MARS uses this

The Weekly Scorecard converts branch hit probabilities into EV and tags each week by threshold. The rolling line is what MARS actually trusts: single-week readings are treated as noise until the rolling window confirms direction. RED weeks trigger doctrine - reduced aggression and review - rather than negotiation.

How it benefits you

You learn to distinguish a bad week from a broken system. Variance stops triggering rule changes, and genuine expectancy decay gets caught while it is still one line on a chart instead of a hole in the account. The GREEN/YELLOW/RED language also makes weekly review fast and unambiguous.

GREEN ≥ +0.25RYELLOWREDROLLING EVW1W2W3W4W5W6W7W8W9W10W11W12

Weekly EV tagged GREEN / YELLOW / RED against expectancy thresholds, with the rolling-EV line separating persistent edge from one lucky week.

Problem 1

Traders confuse profit with edge.

A profitable result can occur under negative expectancy; a losing result can occur under positive expectancy. The difference becomes visible only across repeated observations and properly structured metrics. MARS converts trade evidence into probability ladders and expectancy: probability of reaching 1R, conditional probability of 2R after 1R, branch EV, blended EV, and EV stability — for trend branches, whether the ATR runner was unlocked and whether fat-tail participation justified its variance. The Weekly Trading Scorecard blends branch EV by the live weight profile and answers one question: is the strategy still producing acceptable expectancy under the current mix? The mental model shifts from “I won, therefore the trade was good” to “Did this trade belong to a process that remains positive expectancy, compliant, and repeatable?”

Problem 2

Traders deploy risk emotionally.

Retail traders expand risk when confidence is highest and contract only after meaningful damage — backward, because confidence peaks after winning streaks, exactly when skill is most overestimated. MARS removes mood from capital authority: deployment is governed through current drawdown, gate state, maximum tier, authorized cycle pool, per-trade average risk, active open exposure, cycle evidence, structural permission, and logged overrides. The Throttle Control Panel is the final deployment authority; the Cycle Command Console prepares evidence but does not independently authorize risk. Risk becomes a governed output rather than an emotional input.
Problem 3

Traders ignore drawdown structure.

Most traders treat drawdown as a single number. MARS treats it as a capital-state transition, measured from the most recent Equity Peak High so accumulated gains receive protection as the account grows. The ladder runs Growth (full compounding) → Recovery → Buffer → Floor → Deep-Floor → Ground-Floor → System Lock, each with its own capital posture and maximum deployment authority. A setup can be technically attractive and still receive reduced risk because the capital state is damaged — the quality of one opportunity does not erase the condition of the account, and the gate prevents repairing capital damage with the same aggression that caused it.

Problem 4

04

Traders mismanage open exposure.

Sizing every new trade as if it exists independently ignores the combined downside burden of concurrent positions. MARS distinguishes original risk, current active risk, floating profit, break-even protection, reduced-stop exposure, closed realized results, and remaining cycle capacity. A trade that originally risked 6% but whose stop now leaves 2% exposed counts as 2%. At break-even, active risk may be approximately zero — yet a profitable floating position is not automatically risk-free. The governing question: if the current stop is hit now, how much equity can still be lost? Remaining Pool Capacity = Authorized Cycle Pool − Active Open Risk.

Problem 5

Traders don't know which part of the system is working.

Total account return cannot say whether Normal, Trend Partial, Trend No-Partial, or Overflow trades are producing the edge — and each branch has a different job: Normal is the stable compounding branch; Trend Partial balances early monetization with runner potential; Trend No-Partial preserves full exposure for fat-tail continuation; Overflow is supplemental and must stay controlled. Without branch diagnostics, a trader may believe the whole system is broken when one branch is deteriorating — or believe it healthy while one strong branch hides weakness elsewhere.

  • Normal — the stable compounding branch
  • Trend Partial — early monetization plus runner potential
  • Trend No-Partial — full exposure for fat-tail continuation
  • Overflow — supplemental, and kept controlled

Problem 6

Traders cannot distinguish variance from structural decay.

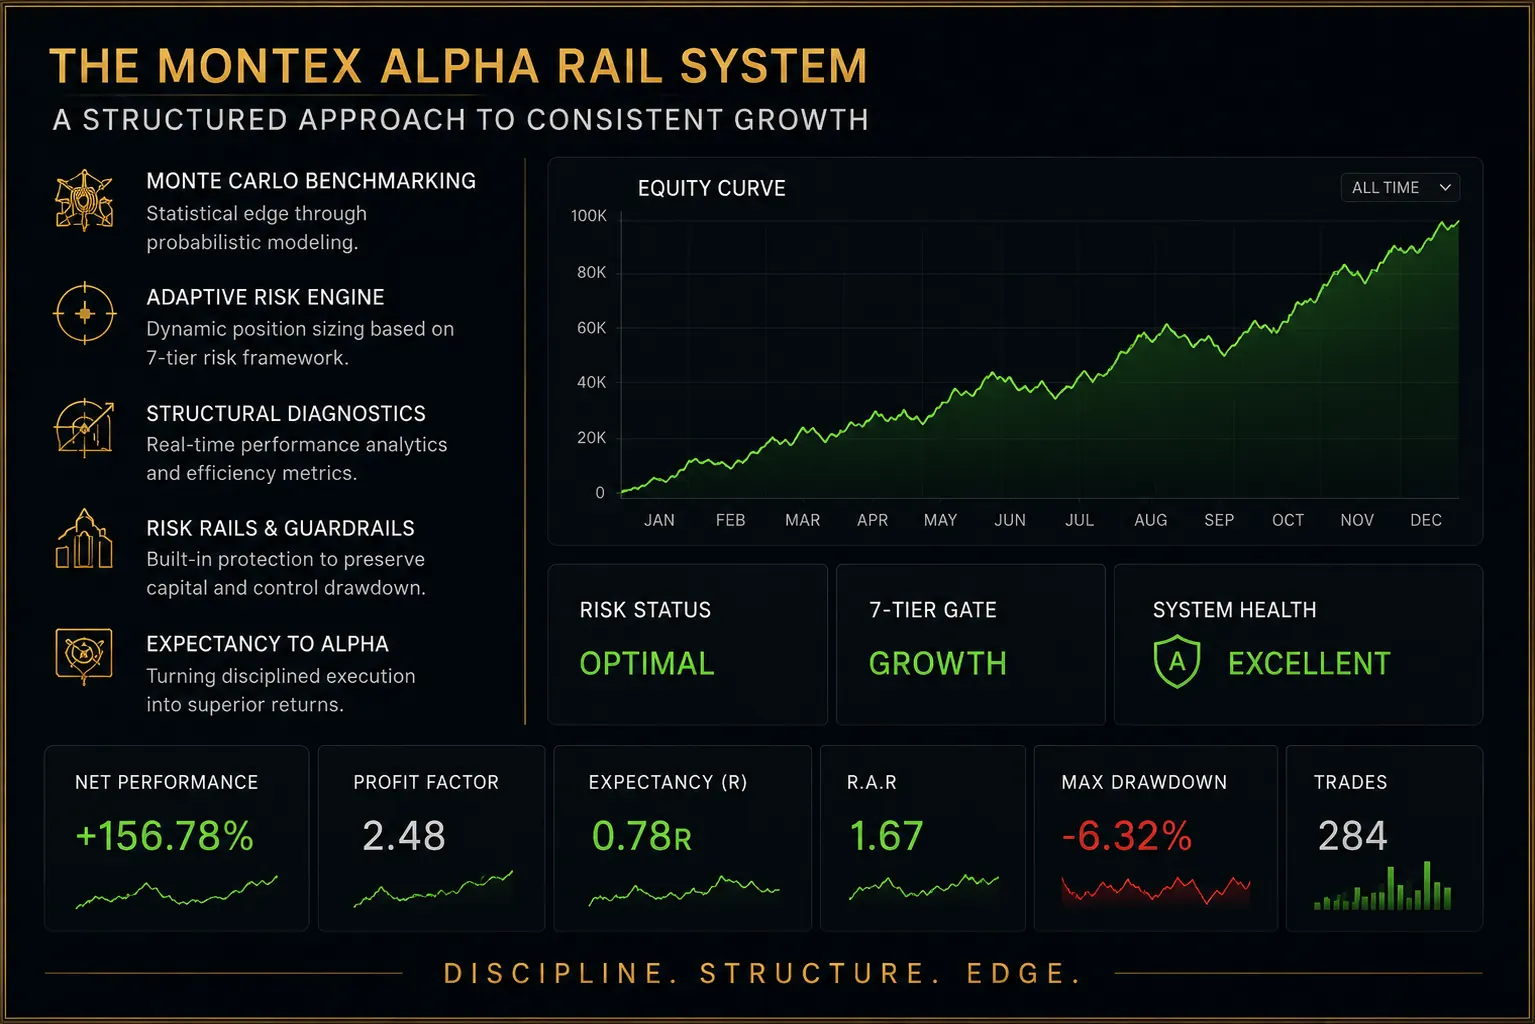
A losing streak is not automatically failure; a winning streak is not automatically confirmation. The Structural Diagnostic Engine evaluates five structural metrics — expectancy, drawdown, Risk-Adjusted Efficiency Ratio, Risk-Adjusted Profit Factor, and equity acceleration — through a standardized six-table pipeline: Structural Truth, Rolling Condition, Stability, Drift, Z-Score, Interpretation. The Monte Carlo benchmark provides the second lens: 50,000 paths modeled with the MARS branch mix, four concurrent trades per cycle, four cycles per week, drawdown gates, dynamic tiers, open-exposure compression, and System Lock assumptions. The benchmark is not a target to chase — it is a ruler that separates normal distributional behavior from genuine divergence. Together they give the trader x-ray vision into the machine.

Reference

Six problems, six answers

The failureThe governing question MARS asksThe module that answers it
Profit confused with edgeIs the process still positive expectancy under the current mix?Weekly Trading Scorecard
Emotional risk deploymentWhat does the evidence authorize — regardless of mood?Throttle Control Panel
Drawdown treated as one numberWhat capital state is the account in, and what aggression is justified?Gate & Brake architecture
Open exposure ignoredIf every current stop is hit now, what can still be lost?Cycle Command Console
Branch blindnessWhich branch is producing edge — and which is leaking it?Branch-level EV analytics
Variance vs. decayIs this inside the expected envelope, or genuine divergence?SDE + Monte Carlo benchmark

Doctrine

Connected inside MARS

This module doesn't work alone.

Go deeper

Operator briefs on this territory.

Every module ships in the complete MARS package.

One price. Eleven workbooks, three TradingView indicators, and the full manual library — $497.