

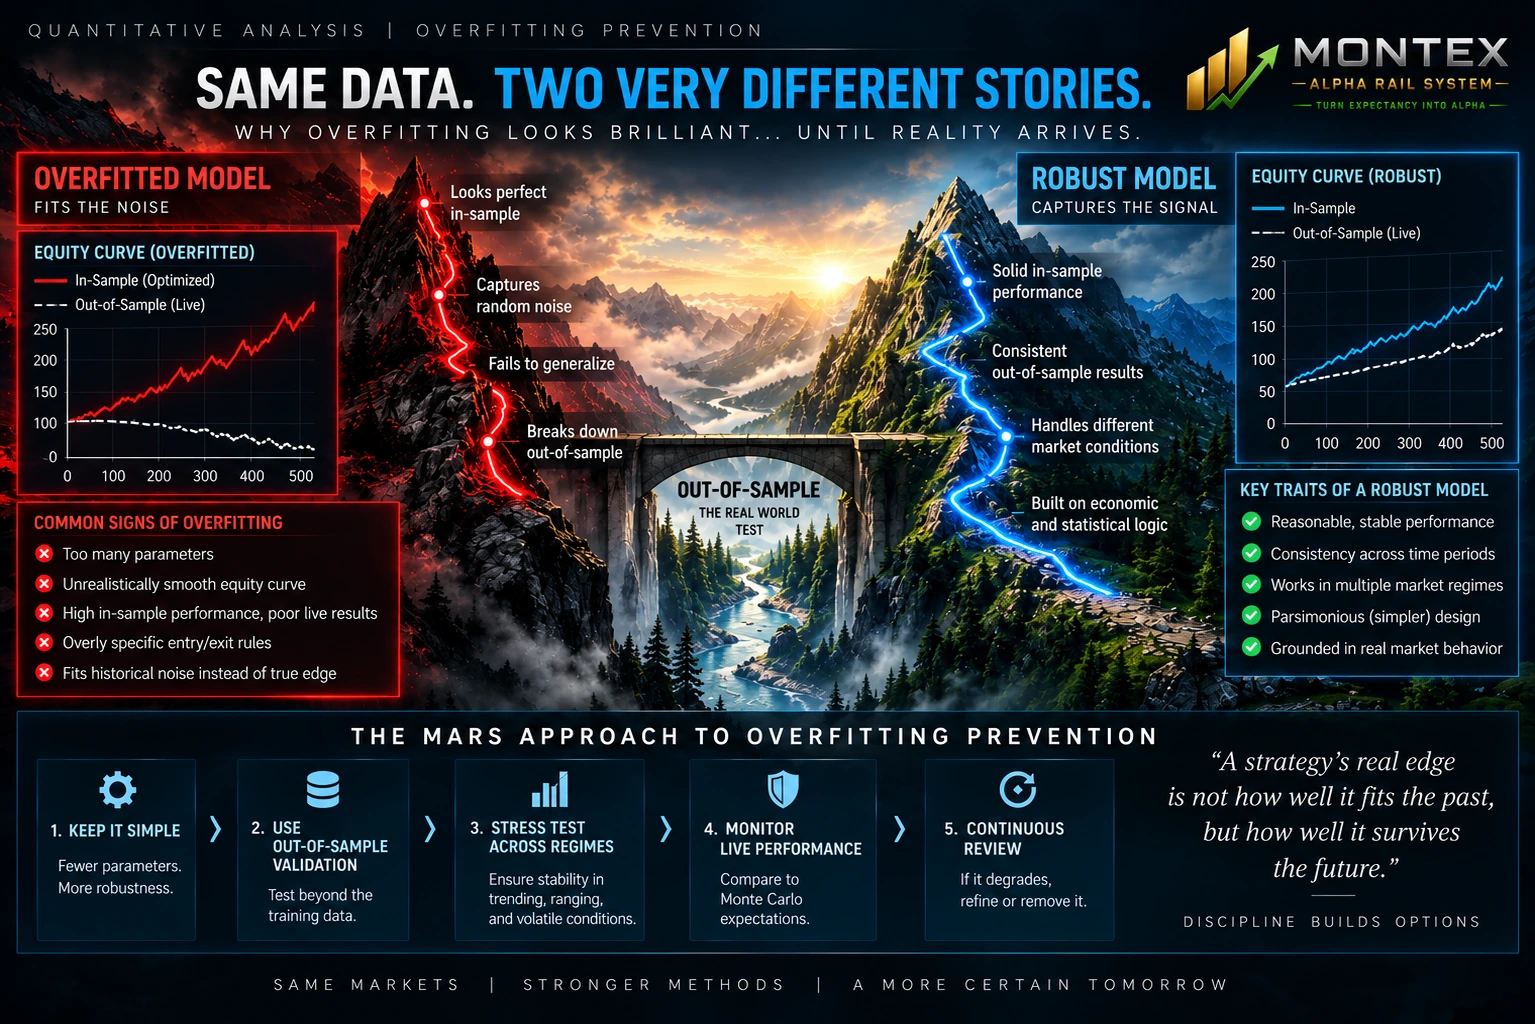
A backtest can be mathematically correct and still be strategically false. The dangerous case is not an obvious coding error; it is a research process that keeps asking the same historical sample questions until the sample finally answers “yes.” In trading research, every extra parameter, filter, branch, threshold, session rule, stop rule, and ranking criterion expands the search space. If the best-looking result is selected after enough tries, its historical performance can become a statistic of the search process rather than evidence of durable alpha.
That is why overfitting prevention belongs inside system governance. MARS is explicitly structured as a discretionary-quant framework in which research tools, production analytics, drawdown authority, live expectancy monitoring, structural diagnostics, and Monte Carlo benchmarking occupy different roles. The objective is not to eliminate experimentation. It is to stop experimentation from quietly rewriting the evidence standard after the outcome is already known.
Core thesis. A robust system should make it progressively harder for a rule to reach live capital as the number of trials, parameters, conditional branches, and observed outcomes increases. The burden of proof must rise with the size of the search space.
The Search Space Is the Hidden Risk
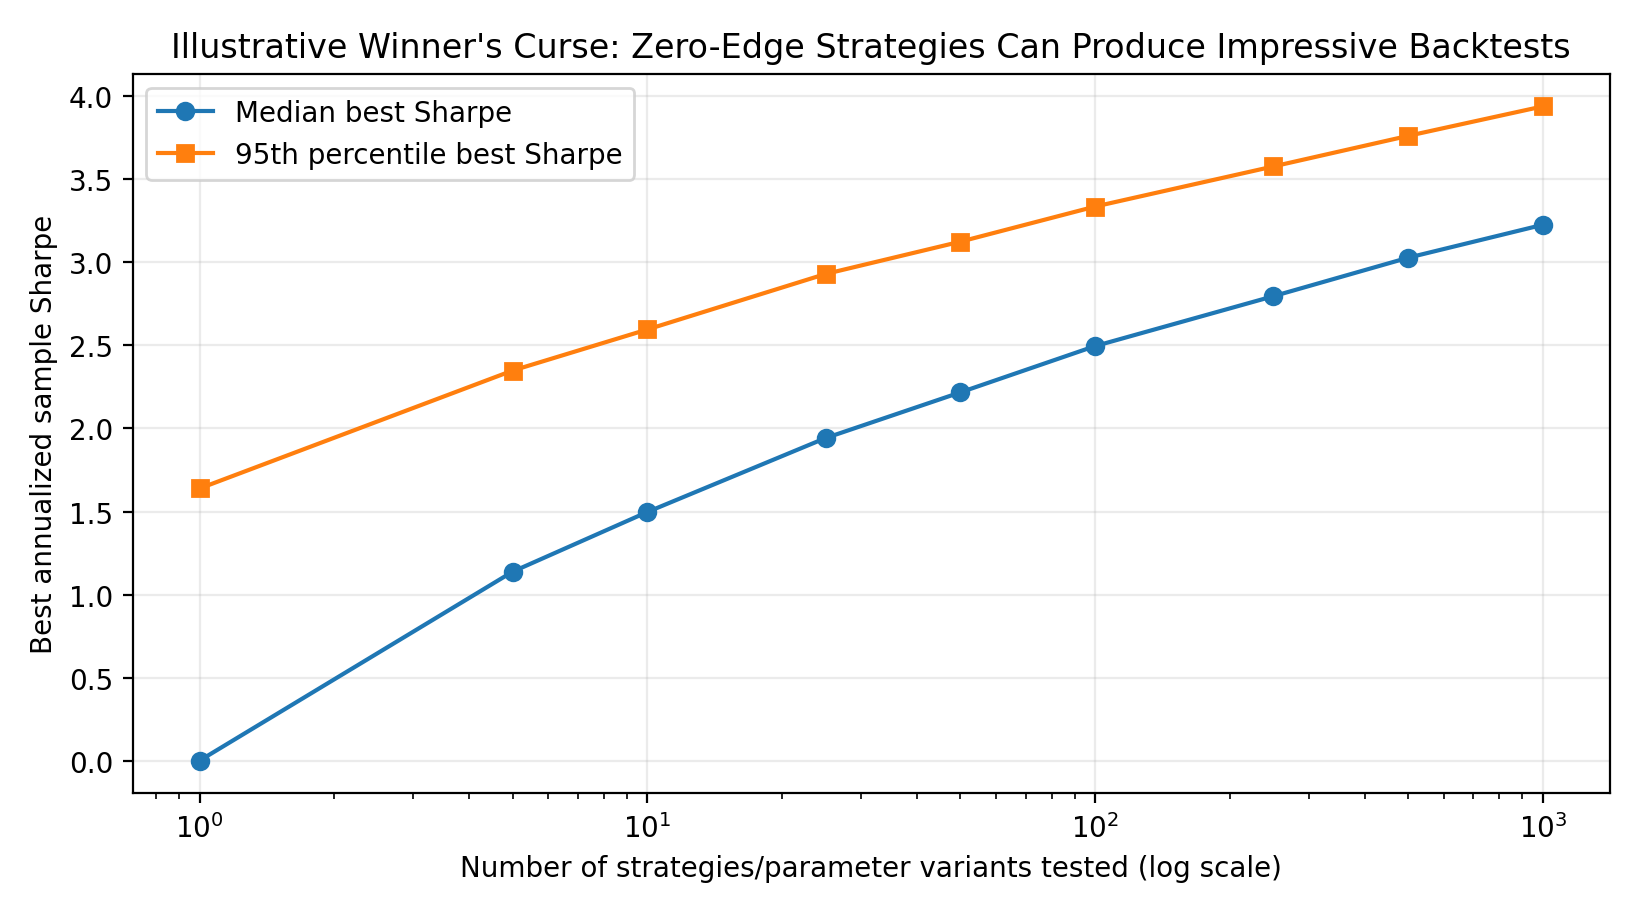
Overfitting is often described as “fitting noise.” That is accurate but incomplete. In trading, the deeper problem is selection under repeated experimentation. Suppose a researcher tests one strategy whose true expected return is zero. A lucky backtest is possible. Now suppose the researcher tests 1,000 variations of entry lookback, ATR length, session window, stop distance, profit target, trend filter, and confirmation threshold, then reports only the winner. The probability that at least one variant looks exceptional rises dramatically even though the entire family may have no genuine edge.
Halbert White formalized the data-snooping problem as the repeated use of the same dataset for model selection and inference. Sullivan, Timmermann, and White later applied this logic directly to technical trading rules. Bailey, Borwein, López de Prado, and Zhu extended the problem to backtest overfitting and proposed the Probability of Backtest Overfitting (PBO), using combinatorially symmetric cross-validation to estimate how often an in-sample winner underperforms out of sample.
The practical lesson is severe: the headline Sharpe ratio, profit factor, win rate, or expectancy is not interpretable without knowing how many alternatives were tried, how correlated those alternatives were, what data were reused, and whether the final specification was fixed before evaluation. A strategy that emerged from 500 failed variants should carry a larger selection penalty than a strategy specified from first principles and tested once.
| Research behavior | Why it inflates apparent edge | Anti-overfit response |
|---|---|---|
| Parameter sweep | The maximum score is selected from many noisy estimates. | Record the full trial count; penalize selection; prefer stable plateaus over single optima. |
| Filter stacking | Each added condition creates another conditional sample and shrinks effective sample size. | Require incremental value out of sample and under perturbation. |
| Repeated holdout use | The “test” set becomes part of training once results influence revisions. | Use nested or staged validation; freeze truly untouched evaluation windows. |
| Metric shopping | The strategy is reframed around whichever metric looks best. | Predefine primary and secondary metrics before seeing results. |
| Survivorship of ideas | Failed variants disappear from memory while winners are preserved. | Maintain a research registry containing rejected as well as accepted candidates. |
For an advanced MARS workflow, this matters because the system naturally contains multiple analytical dimensions: branch identity, variant logic, volatility state, gate state, execution quality, EV, drawdown, risk efficiency, Monte Carlo percentiles, and structural diagnostics. That richness is an advantage only when authority boundaries are preserved. If every diagnostic is allowed to become a new optimization knob, the same instrumentation designed to detect edge decay can become an engine for manufacturing backtest fit.
MARS implication. A metric is not automatically a parameter. EV, drawdown, RAER, RAPF, equity acceleration, MAE/MFE, regime classification, and volatility telemetry should first be treated as diagnostic evidence. Promoting any of them into a live rule requires a separate validation event.
The Deflated Sharpe Ratio attacks a related problem from another angle. A conventional Sharpe significance assessment can be too optimistic when the selected Sharpe came from many trials or when returns are skewed and heavy-tailed. DSR increases the performance threshold required for credibility as the number and dispersion of tried strategies rises. For MARS, the equivalent governance idea is broader than Sharpe: the more branch variants, parameter settings, filters, or scenario profiles examined, the more demanding the promotion standard should become.
PBO reframes the question from “Did the best strategy work?” to “How often does an in-sample winner rank poorly out of sample?” In combinatorially symmetric cross-validation, the historical sample is divided into multiple blocks, combinations of blocks are assigned to training and testing, and the relative rank of the selected in-sample winner is measured on the corresponding test set. A high estimated probability that winners become losers is direct evidence that the search process is extracting noise. The method is especially relevant when many strategies are compared on the same finite history.
For trading systems, independence is not required for the problem to exist. Parameter variants are usually highly correlated: ATR(20) and ATR(21) are almost the same experiment; a 1.55R and 1.60R trigger are neighboring rules. Correlation reduces the effective number of independent trials, but it does not make the selection effect disappear. This is why simply counting raw parameter combinations can overstate the search breadth, while ignoring the breadth entirely understates it. Advanced research should record both the literal trial count and the structure of the search family.
The selection problem can be stated compactly. Let S1, S2, …, SN be estimated performance statistics for N candidate strategies. Even when every candidate has the same true expected performance, the expected maximum, E[max(Si)], rises with N because the researcher is selecting the upper order statistic of a noisy distribution. This is the statistical core of the winner’s curse. The backtest winner is not merely an estimate of the best rule; it is the best estimate after conditioning on being selected. Conditioning matters because selection creates optimism.
The Mathematics of Selection: Why “Best” Needs a Penalty
Validation Architecture: Separate Discovery From Permission
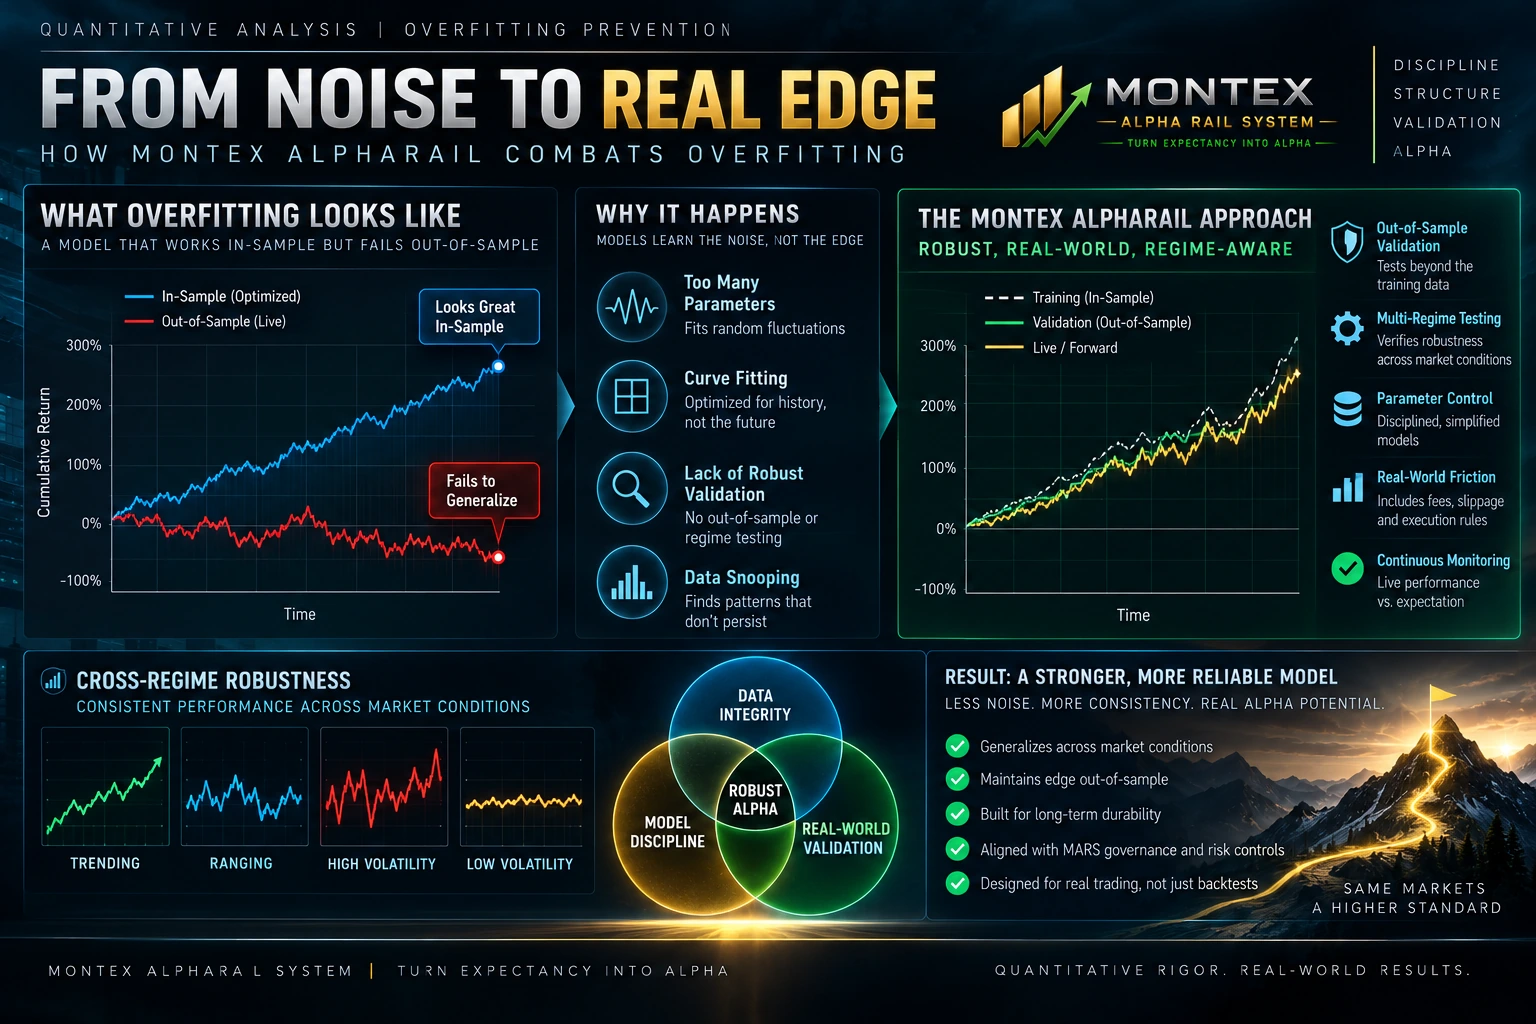
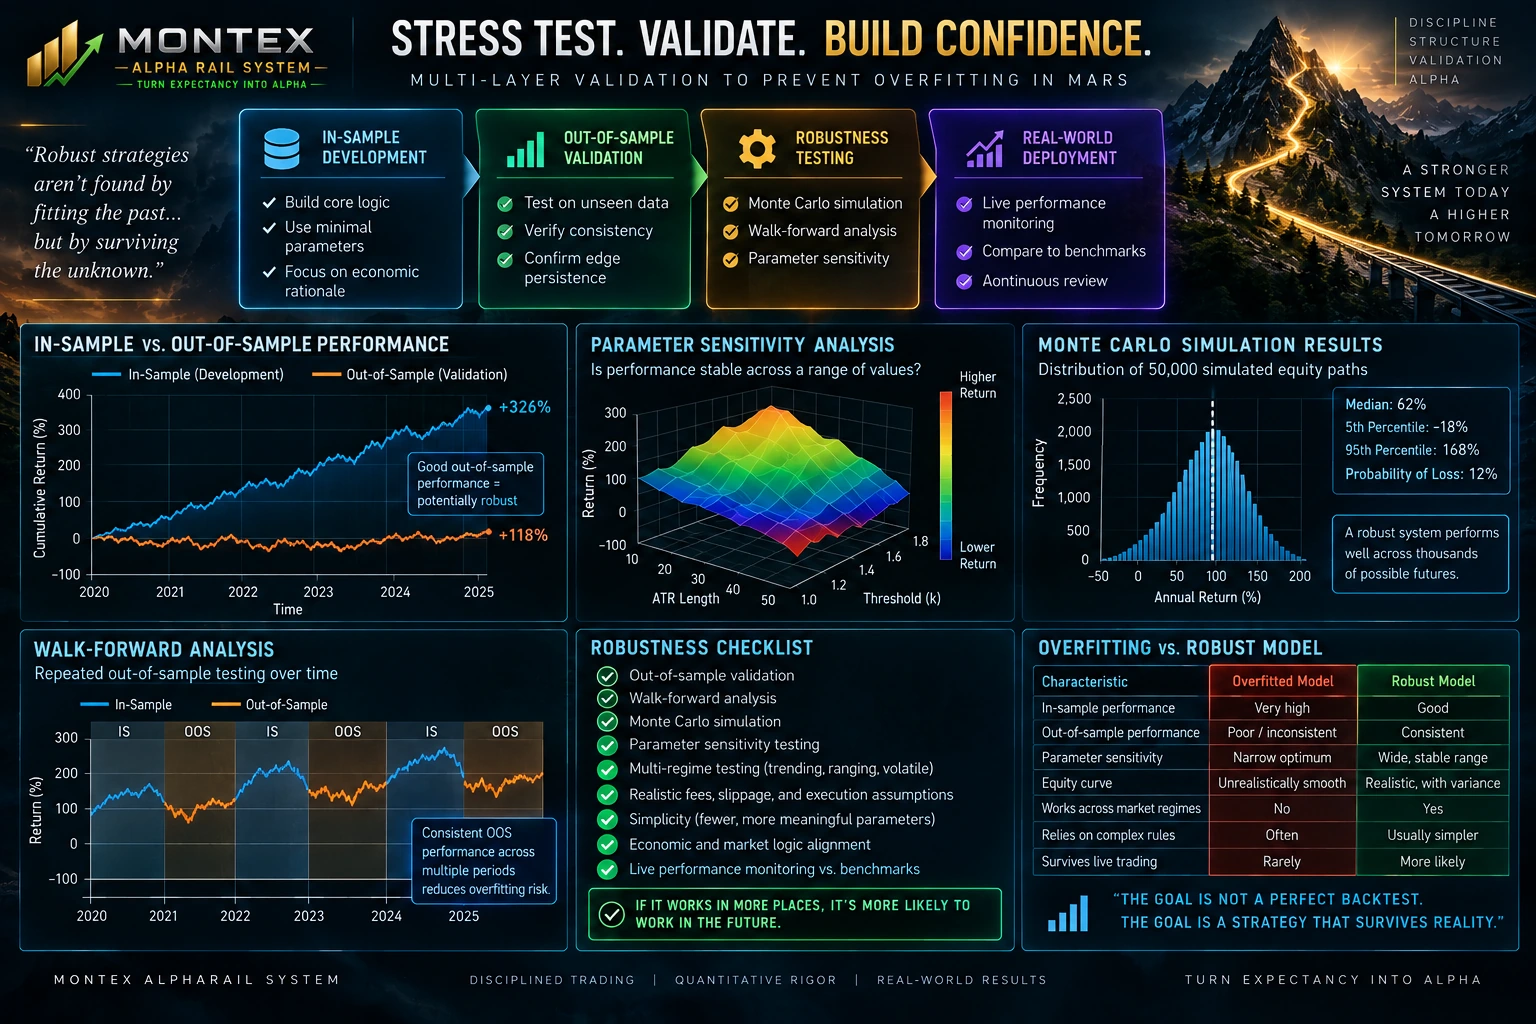
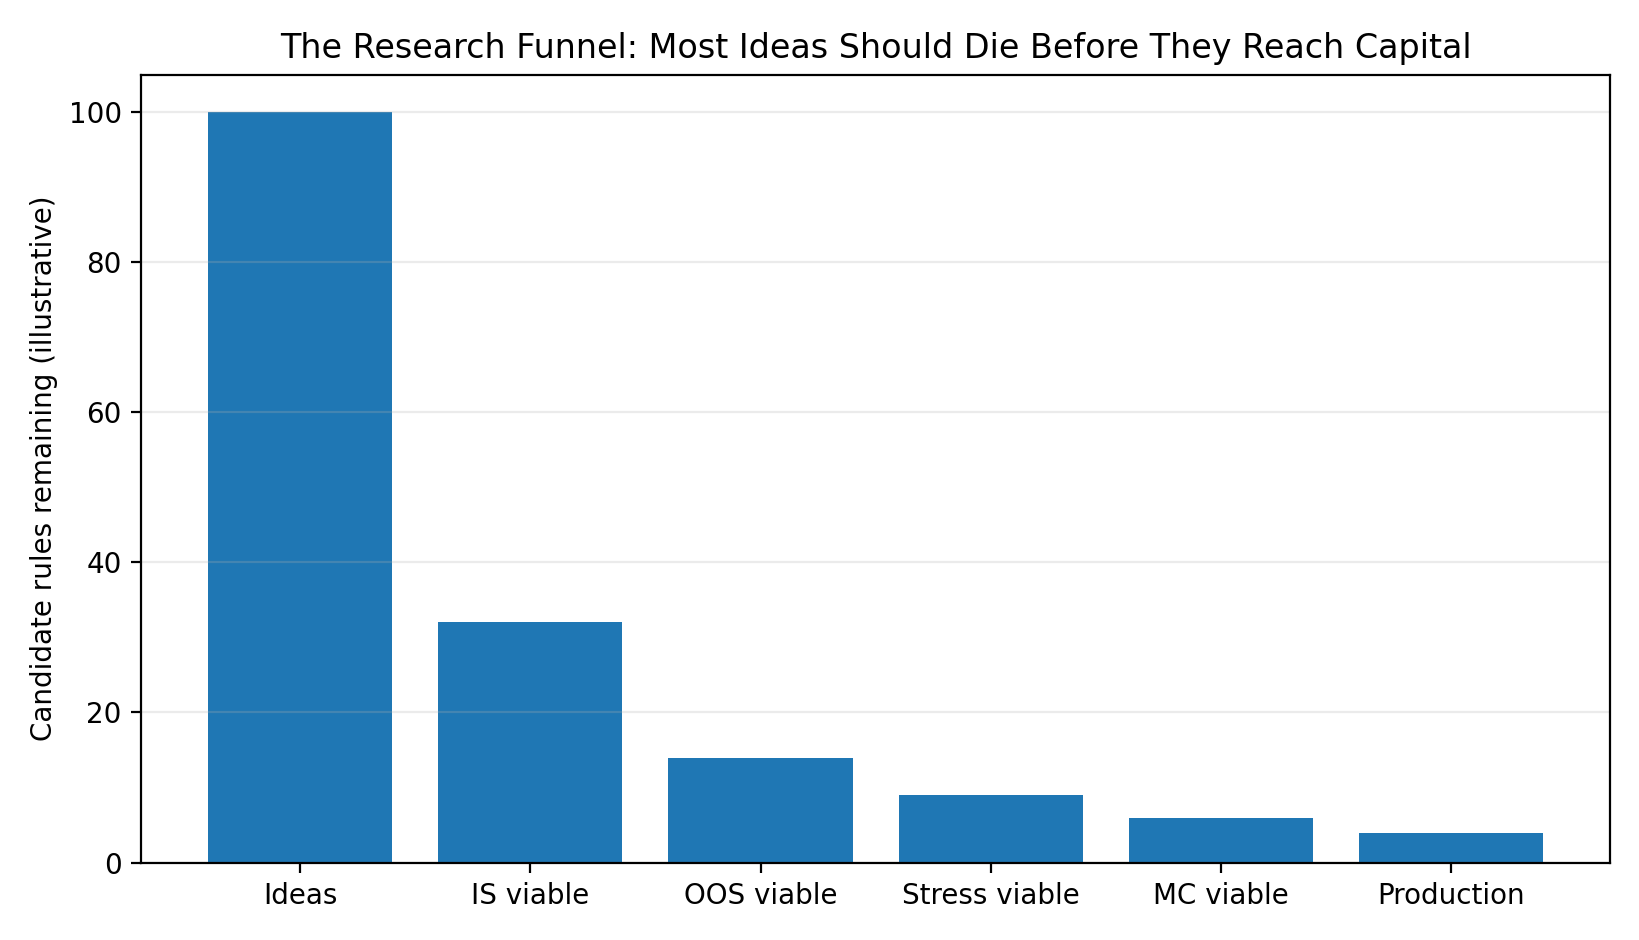
The strongest overfitting defense is architectural rather than cosmetic. A researcher should not be able to optimize and approve the same rule inside the same evidence loop. Discovery asks, “What might work?” Validation asks, “What survives?” Production asks, “What is authorized now?” Those are different questions and should be answered by different data slices, different procedures, and ideally different review surfaces.
The familiar train/test split is often too weak for trading because market data are time dependent, samples are limited, and researchers tend to revisit the holdout set. Once a holdout result causes a parameter change, the holdout is no longer pristine. For path-dependent strategies, a more serious process uses walk-forward or purged/embargoed cross-validation where appropriate, plus perturbation tests, cost stress, regime segmentation, and Monte Carlo analysis of outcome sequencing.
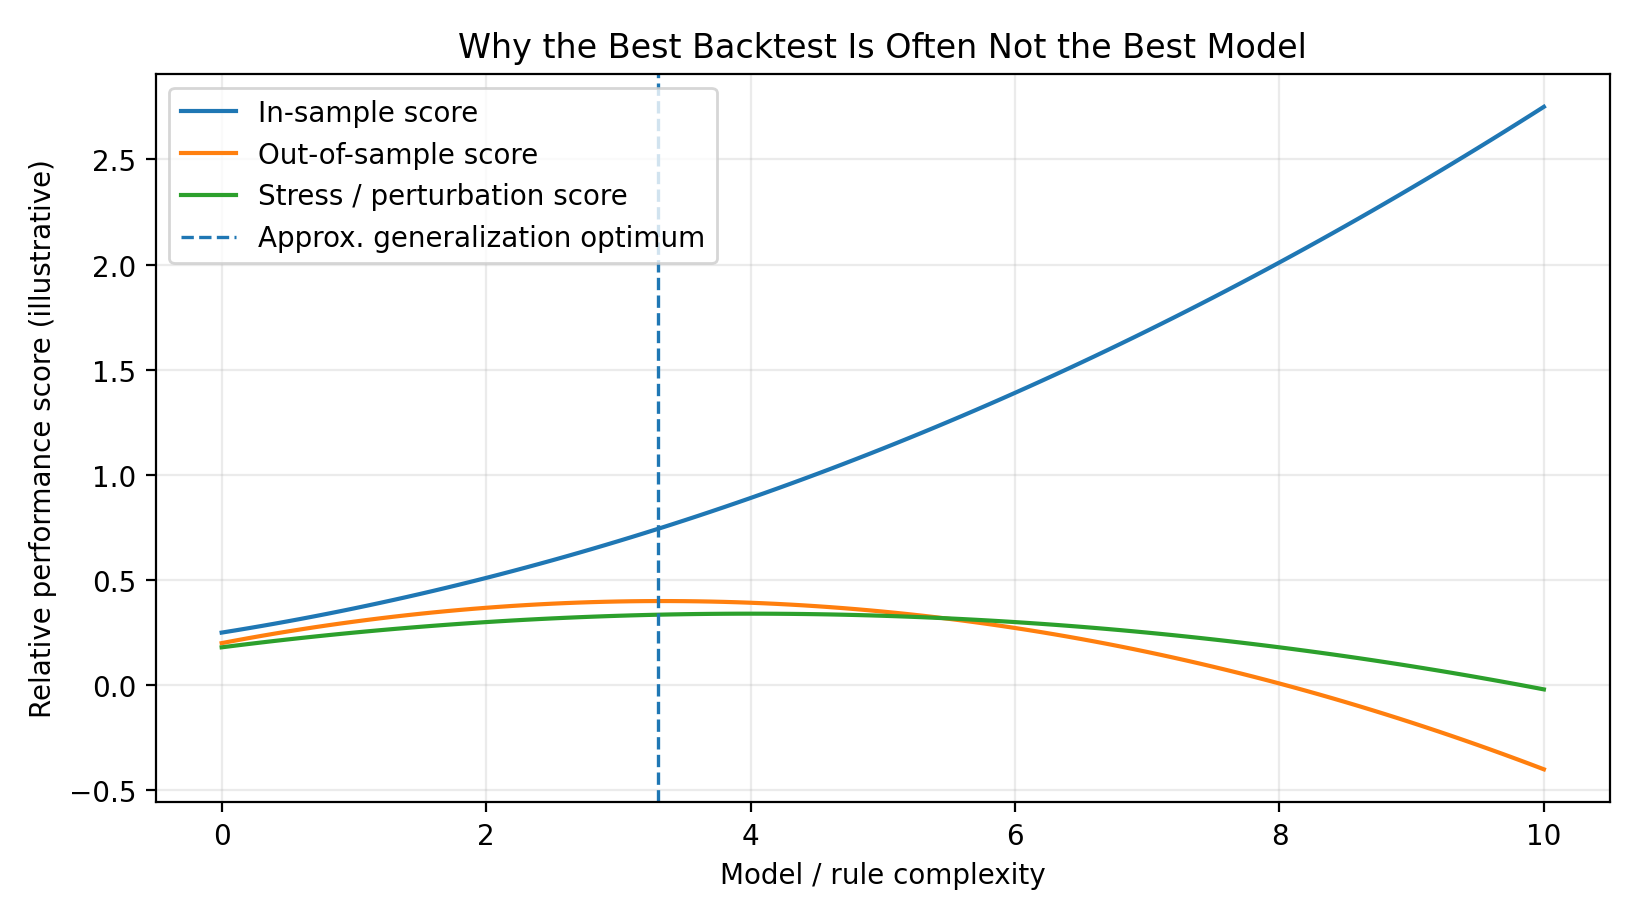
A central concept is robustness topology. A parameter value should not be trusted because it is the single highest point on a surface. It is more credible when nearby values produce similar behavior. A narrow spike is usually fragile: small changes in spread, fill, volatility, timing, or market regime can erase it. A broad plateau is less glamorous but usually more deployable.
| Validation layer | Primary question | Failure that should kill or redesign the candidate |
|---|---|---|
| Economic / structural rationale | Why should this edge exist? | No plausible mechanism beyond “the backtest liked it.” |
| In-sample research | Can the idea be specified coherently? | Requires excessive parameters or unstable rule interactions. |
| Out-of-sample / walk-forward | Does performance generalize to unseen periods? | Large collapse in EV, hit rate, payoff, or execution quality. |
| Perturbation / sensitivity | Does it survive nearby settings and realistic friction? | Edge exists only at one exact threshold or disappears with modest costs. |
| Regime segmentation | Is the edge conditional in a way that can be measured prospectively? | Performance is concentrated in a regime that cannot be identified without hindsight. |
| Monte Carlo / path stress | Can the distribution survive adverse sequencing? | Acceptable mean return but intolerable lock probability, drawdown, or recovery burden. |
| Shadow / low-authority production | Does the live process reproduce the assumptions? | Live slippage, behavior, branch mix, or execution differs materially from model assumptions. |
Multiple-testing control belongs here as well. White's Reality Check, Hansen-style predictive ability tests, and Romano-Wolf stepwise procedures address different forms of selection across many candidate models. For performance ratios, Bailey and López de Prado's Deflated Sharpe Ratio explicitly adjusts for selection bias and non-normal returns. These are not interchangeable tools, and not every discretionary system needs every test, but the principle is universal: when the research process searches widely, the evidence threshold must acknowledge the search.
Rule of research hygiene. Never let “we changed the rule because the test failed” be followed by “and we still call the same test out-of-sample.” Once feedback changes the model, that dataset has entered the research process.
Transaction costs are also a form of validation. A parameter that works only before spread, commission, swap, and slippage is not a fragile edge; it is no edge at all. Cost stress should be asymmetric when appropriate. Thin-liquidity sessions and fast markets can generate worse fills exactly when the strategy is most active. Treating costs as one fixed average can therefore hide path-specific fragility.
Regime tests require similar discipline. If a rule is declared profitable only during “high-volatility trend regimes,” the regime definition must be computable prospectively from information available at the time. A regime label derived after observing the full move creates hindsight leakage. MARS’s architecture is well suited to avoid that error because volatility intelligence and regime interpretation can be defined as separate evidence layers. The rule should specify what information was available before the trade, not what became obvious after the trade closed.
The next layer is perturbation. If a strategy uses an ATR coefficient of 1.60, validation should ask what happens at 1.50, 1.55, 1.65, and 1.70, under slightly worse spread, under delayed entry, and under a small shift in session timing. The purpose is not to find another optimum. It is to test whether the claimed mechanism occupies a region of stability. Robustness is a property of neighborhoods, not peaks.
A disciplined workflow uses time-aware splits. Walk-forward validation preserves chronology: the model is calibrated on an earlier window and evaluated on a later window, repeatedly. Purging can remove training observations whose information sets overlap the test period. An embargo can add a buffer around test boundaries to reduce leakage from nearby observations. These techniques are particularly important when labels are generated from forward-looking trade outcomes or when holding periods vary.
Financial time series create leakage channels that do not appear in textbook IID examples. A trade may remain open across several bars, labels can overlap in time, volatility regimes persist, and adjacent observations are serially related. Randomly shuffling observations into conventional K-fold cross-validation can therefore place economically connected information on both sides of the train/test boundary. The result is an apparently clean holdout that is not truly independent.
Leakage Control for Time-Series Trading Research
The MARS Anti-Overfit Stack: Benchmark the System, Not the Story
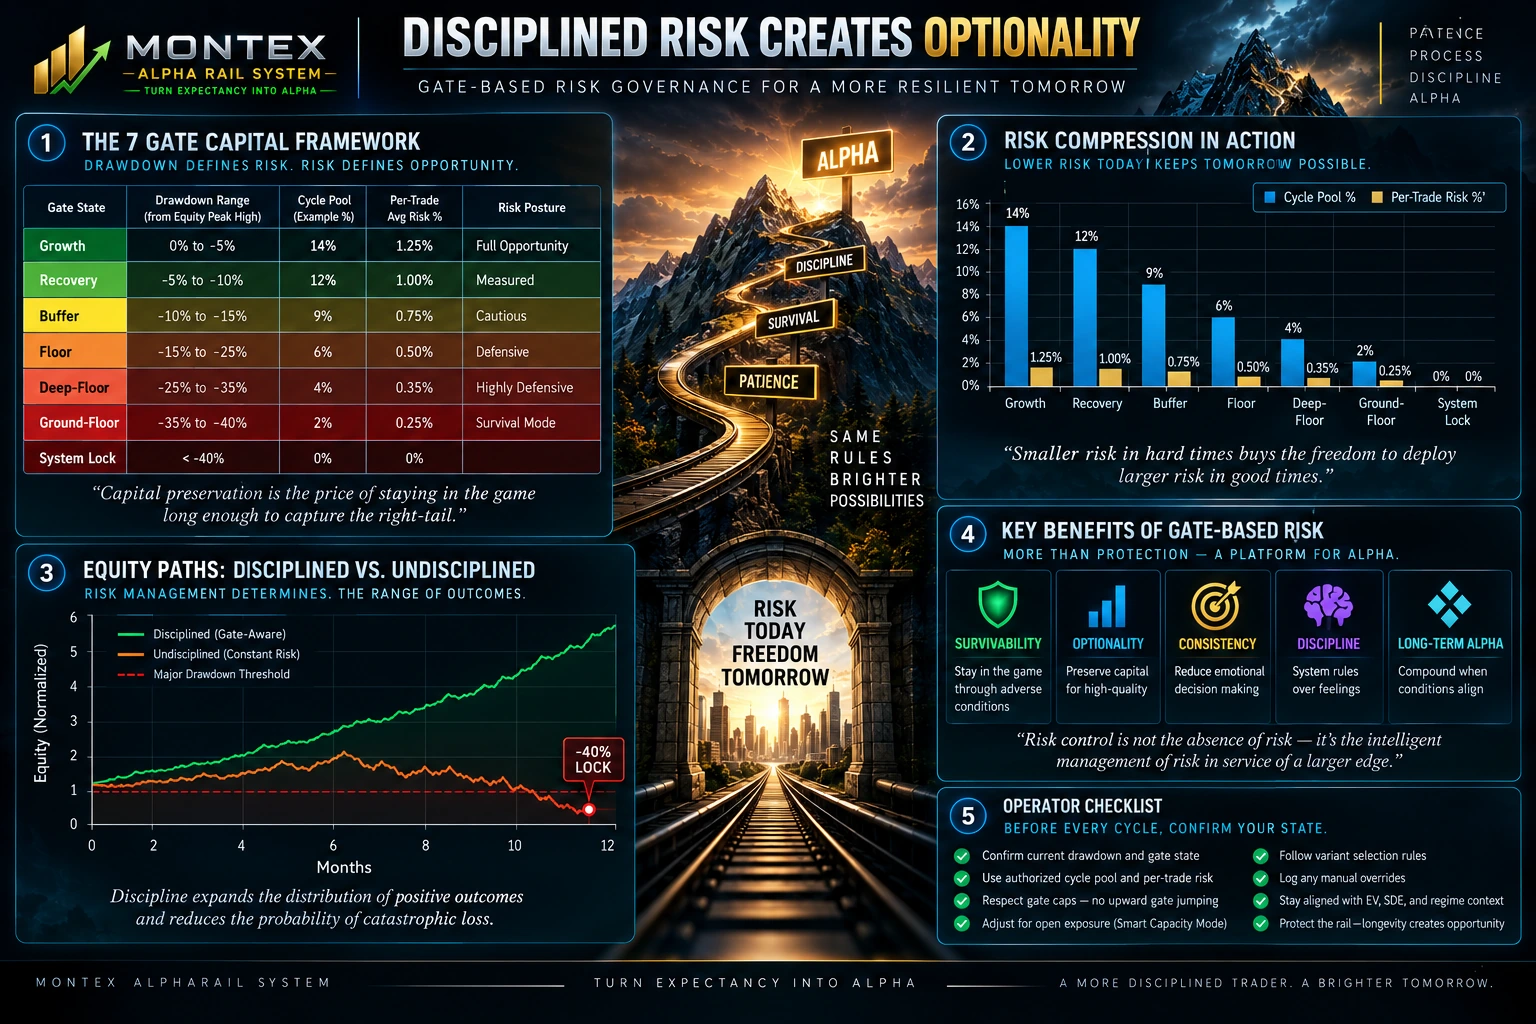
MARS has a useful structural advantage for overfitting prevention: its major modules are designed around separate authority functions. The EV Lab and sensitivity tools are research surfaces; the Weekly Trading Scorecard and CP3 measure live expectancy; the Gate/Brake and Throttle layers control capital authority; the Structural Diagnostic Engine interprets longer-horizon behavior; and the Dynamic Seven-Tier Monte Carlo benchmark acts as a probabilistic ruler. That separation should be preserved rigorously.
The Monte Carlo layer is particularly important because a deterministic historical equity curve creates false certainty. A strategy can have positive expectancy and still experience long loss clusters, deep drawdowns, delayed milestones, or lock events. MARS's benchmark doctrine explicitly treats the simulation as a ruler rather than a motivational target and reads live results against percentile bands, drawdown behavior, gate dwell, tier usage, exposure compression, and survival-adjusted compounding.
That is a stronger anti-overfit posture than asking whether live P&L is above or below the backtest. A live equity path can lag the median while remaining statistically ordinary. Conversely, it can outrun the median while being structurally unhealthy if the outperformance comes from excessive risk, abnormal tier deployment, poor compliance, or drawdown outside the expected envelope.
| MARS layer | Proper anti-overfit role | What it must not become |
|---|---|---|
| EV Lab / sensitivity research | Test candidate rule and profile changes away from production. | A live-rule generator that promotes settings because they won the latest sample. |
| Weekly Scorecard / CP3 | Measure realized branch and blended expectancy, costs, adherence, and risk behavior. | A tuning console for rewriting rules after every week. |
| Monte Carlo benchmark | Define expected distributions for equity, drawdown, gate dwell, tier usage, lock risk, and path speed. | A guaranteed forecast or a target that justifies risk escalation. |
| SDE / structural diagnostics | Detect drift across EV, DD, RAER, RAPF, acceleration, stability, and rolling windows. | A single composite score that automatically overrides hard capital authority. |
| Gate / Throttle | Constrain capital by drawdown and authorized deployment. | A performance optimizer designed to maximize historical CAGR. |
| MAE/MFE / variant attribution | Explain execution leakage and branch/variant contribution. | A post-hoc excuse to alter exits until every losing trade disappears. |
The distinction between diagnosis and optimization is the key. Suppose Trend No-Partial shows a weak six-week capture profile. A diagnostic response asks whether the weakness is driven by entry timing, volatility regime, fees, trail coefficient, branch selection, or normal variance. An overfit response immediately changes the trail coefficient to whichever value would have improved those six weeks. The first response preserves causal uncertainty. The second converts recent noise into a new parameter.
This is also why MARS should keep benchmark assumptions versioned. If branch weights, risk tiers, gate thresholds, trade frequency, exit rules, or transaction-cost assumptions change materially, the old benchmark is no longer a clean ruler. A new benchmark should be generated under the promoted rule set, while the prior benchmark remains archived. Otherwise the system risks comparing a moving live architecture against a static simulation and attributing the mismatch to 'alpha' or 'underperformance' when it is actually model drift.
A production-grade MARS promotion rule. A rule change should move through: hypothesis → registered experiment → sensitivity/robustness tests → untouched or walk-forward validation → cost and regime stress → Monte Carlo path stress → documented approval → new versioned benchmark → live shadow/limited authority → production review. Skipping stages is not speed; it is borrowing confidence from the same data twice.
This governance layer would make MARS more resistant to a common discretionary-quant failure: using sophisticated analytics to rationalize discretionary revisions. The richer the dashboard becomes, the more important it is to define which outputs may trigger investigation and which outputs may directly alter rules. An analytical ecosystem is safe when information flow is abundant but authority flow is narrow.
There is also a strong case for a champion/challenger framework. The current production rule is the champion. New ideas run as challengers in shadow mode or with deliberately limited authority. A challenger should not replace the champion because it produced one superior recent month. It should demonstrate a better distribution after costs, acceptable drawdown and path risk, robustness to perturbation, and repeatability across fresh data. The burden is improvement without hidden risk, not merely higher historical return.
A production promotion should create an immutable rule package: branch definitions, variant mechanics, risk assumptions, benchmark configuration, expected transaction costs, approved assets, applicable sessions, and the version of every dependency used in the test. The Dynamic Seven-Tier Monte Carlo benchmark should then be refreshed under that package. If the production rule later changes, it receives a new version rather than silently overwriting the old one. This creates auditability and makes live-versus-benchmark comparison intellectually honest.
The ledger should distinguish three statuses: exploratory, validated candidate, and production-authorized. Exploratory work can be broad and creative. Validated candidates have survived the predeclared test battery but still have no capital authority. Production authorization occurs only after governance review and versioning. This mirrors the existing MARS principle that lower analytical layers cannot override higher capital authority. Research conviction should not be a shortcut around the Gate/Brake or Throttle hierarchy.
The cleanest extension to the current MARS architecture is a formal research ledger. Every experiment should receive an identifier, hypothesis, owner, date opened, data universe, parameter family, primary metric, secondary risk metrics, transaction-cost assumptions, and a declared validation plan. The ledger should also record failed experiments. This is not bureaucracy for its own sake; it preserves the denominator. Without the failed trials, future reviewers see only a museum of winners and cannot estimate how much selection occurred.
Why MARS Needs a Research Ledger and a Promotion Constitution
Production Governance: Detect Edge Decay Without Re-Optimizing Noise
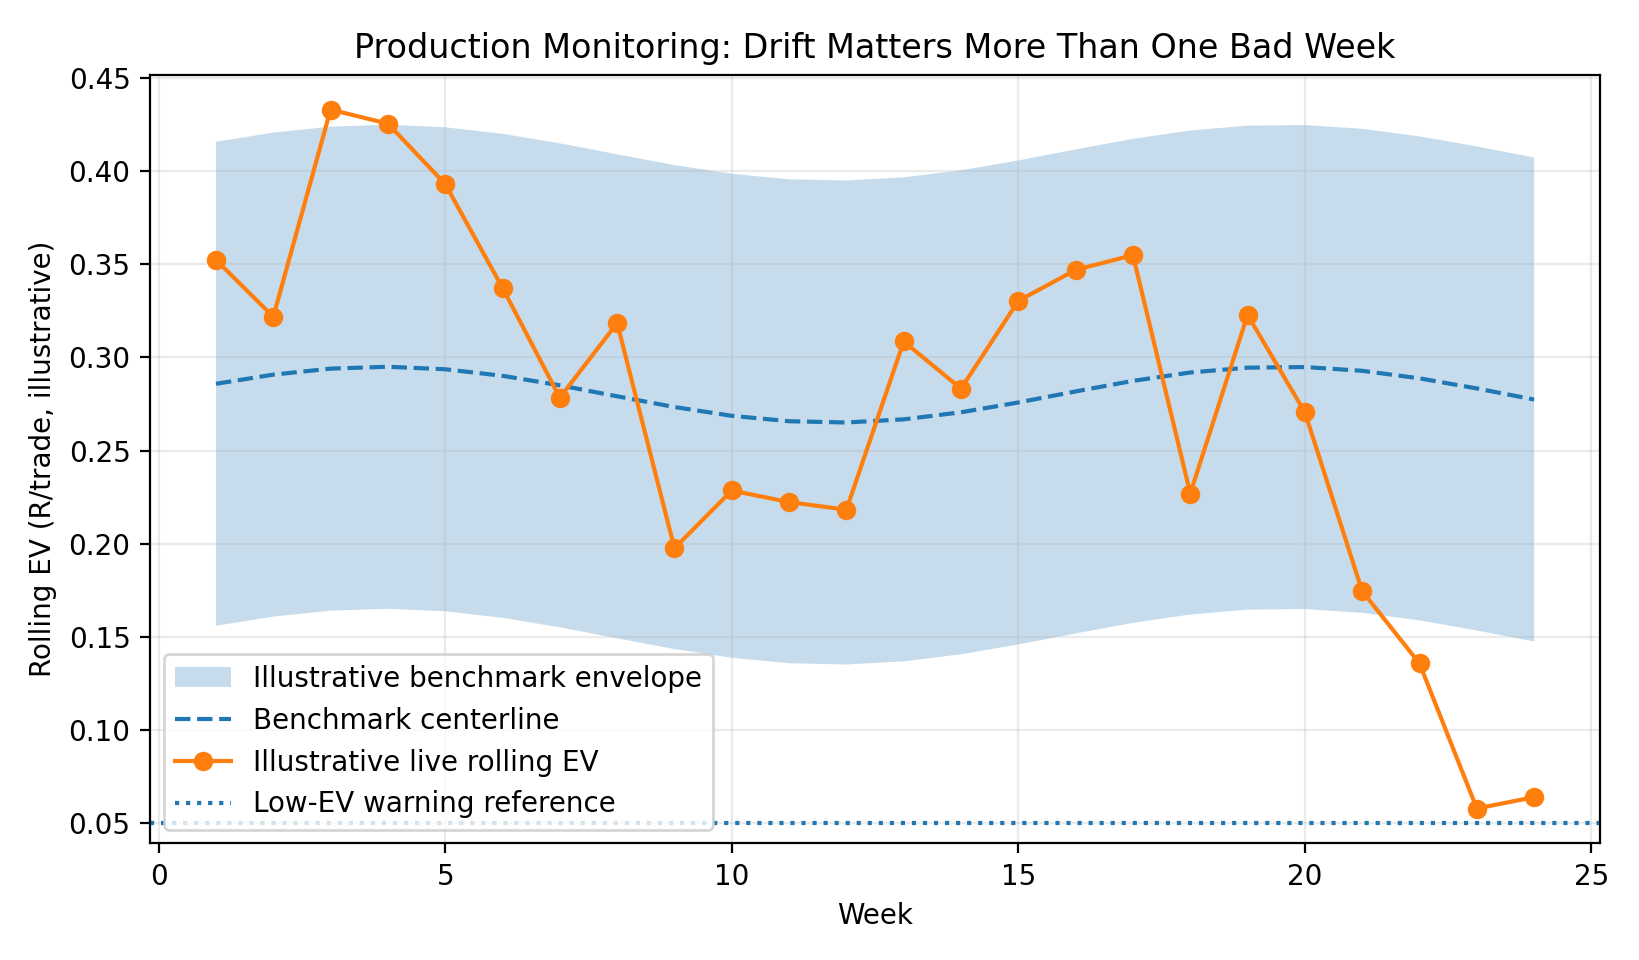
Overfitting does not end when a strategy goes live. Production creates a new temptation: every disappointing week becomes a request to 'fix' the model. This is online overfitting—continually adapting the system to the most recent realized path. A mature process distinguishes evidence of structural decay from ordinary variance.
MARS already has the pieces for that distinction. Weekly EV provides a fast lens. Drawdown determines capital state. The SDE separates rolling condition, stability, drift, and z-score strength across multiple horizons. The Regime Classification Engine summarizes internal system condition without replacing hard capital authority. MAE/MFE attribution can identify execution leakage. The Monte Carlo benchmark supplies an external distributional frame. Together, these layers make it possible to ask whether a weak period is statistically plausible, operationally caused, or structurally persistent.
The correct response to a bad week is therefore not “optimize.” It is “classify.” Was the branch mix unusual? Did transaction costs rise? Did adherence fall? Did live EV move outside its normal band? Did drawdown deepen faster than the benchmark? Did gate dwell become abnormally defensive? Did MAE rise while MFE stayed intact, suggesting entry degradation? Did capture efficiency fall, suggesting exit leakage? Only after diagnosis establishes a repeatable mechanism should a new research hypothesis be opened.
| Observed condition | Likely classification | Governance response |
|---|---|---|
| One weak week; benchmark-normal drawdown; stable longer-window EV | Normal variance | Do not tune. Continue authorized process and collect evidence. |
| Weak EV + rising fees/slippage + stable setup opportunity | Execution/cost leak | Repair execution process or cost filters; do not rewrite core edge prematurely. |
| Weak EV + rising MAE + lower MFE on one branch | Branch-selection or entry-quality issue | Open branch-specific diagnostic review; compare variants and regime context. |
| Live results below MC P10/P5 bands with abnormal gate dwell or lock pressure | Model or governance mismatch | Formal audit: assumptions, sizing, branch mix, costs, throttle behavior, and compliance. |
| Persistent multi-window EV decay + worsening DD/RAER/RAPF + corroborating SDE drift | Possible structural edge decay | Freeze expansion, initiate controlled research, and require fresh validation before changes. |
| Strong P&L but abnormal risk, overrides, or drawdown | False alpha / leverage contamination | Treat as governance failure, not success. Normalize authority before judging edge. |
A useful discipline is the pre-committed change threshold. Before the next bad period occurs, define what combination of evidence is required to trigger research. For example: a minimum sample size, persistent EV degradation across specified rolling windows, drawdown outside a benchmark percentile, deterioration in at least one risk-efficiency measure, and no obvious data-quality or cost explanation. The exact thresholds should be calibrated to the system, but the decision rule should exist before the evidence is observed.
This turns overfitting prevention into an operating doctrine: MARS does not need to prove that every live deviation is meaningful. It needs to avoid converting every deviation into a new rule. A system that survives because it adapts to every recent outcome is not robust; it is merely synchronized to its own history. The goal is slower and more demanding: preserve enough statistical humility that genuine edge has time to express itself, while maintaining enough diagnostic resolution to detect when the production process no longer resembles the model.
Final principle. The most dangerous parameter in a trading system is the researcher's freedom to keep trying. Overfitting prevention is the discipline of placing governance around that freedom.
Overfitting prevention therefore becomes part of MARS’s core identity. Expectancy remains the master performance lens, drawdown remains the survivability governor, the secondary efficiency metrics explain conversion quality, and Monte Carlo remains the benchmark ruler. But none of those measurements should be allowed to rewrite the machine simply because the latest path is uncomfortable. The system earns the right to adapt only when the evidence for adaptation is stronger than the evidence that created the current rule.
The final test is whether a proposed repair has prospective meaning. “Move the stop because that would have saved the last three losers” is retrospective. “The last twelve weeks show rising MAE without corresponding MFE improvement in a prospectively identifiable volatility state; test whether a wider stop improves net EV after costs across independent periods” is a valid research hypothesis. The difference is not wording. It is whether the hypothesis can fail on fresh evidence.
This structure protects against two opposite errors. The first is underreaction—ignoring genuine decay because every loss is dismissed as variance. The second is overreaction—changing the system every time variance becomes uncomfortable. MARS’s multi-horizon SDE design is valuable precisely because it can separate fast movement from structural movement. A four-week signal can be an early warning; a twelve-week signal and cumulative anchor provide slower context; stability and drift determine whether the warning deserves conviction.
A practical MARS escalation protocol can use evidence tiers. Tier A is observation: one metric deteriorates, but the system remains inside benchmark-normal behavior. Tier B is corroboration: two independent lenses deteriorate, such as EV plus execution efficiency, or drawdown plus risk efficiency. Tier C is structural review: degradation persists across multiple windows, benchmark position becomes abnormal, and data-quality or cost explanations have been eliminated. Only Tier C should normally open a rule-change research project.
Once live trading begins, the statistical problem changes from model selection to sequential monitoring. Repeatedly checking performance and acting whenever a metric crosses an informal threshold can create another multiple-testing problem. If the trader looks at EV, drawdown, profit factor, RAER, RAPF, acceleration, branch attribution, MAE/MFE, regime labels, and Monte Carlo percentiles every week, eventually something will look alarming by chance. The solution is not to stop monitoring; it is to predefine escalation logic.
A Change-Control Protocol for Live Edge Decay

MARS Overfitting-Prevention Checklist
- Register the hypothesis and primary success metrics before evaluating the candidate.
- Log all meaningful parameter/model trials, including failures.
- Keep research, validation, and production data roles distinct.
- Prefer parameter plateaus and stable neighborhoods to sharp historical optima.
- Stress realistic spread, commission, slippage, swap, and execution timing.
- Validate across time and, where relevant, regime, asset, session, and branch.
- Account for multiple testing when a large candidate universe was searched.
- Use Monte Carlo to evaluate sequence risk, drawdown, lock probability, and path dispersion—not just mean return.
- Version the benchmark whenever production assumptions materially change.
- Require persistent, multi-metric evidence before opening a live-rule revision.
- Keep diagnostic modules diagnostic until a rule is formally promoted.
- Archive old versions so the research history remains auditable.
Tags
overfitting prevention • backtest overfitting • quantitative validation • data snooping • Monte Carlo benchmarking • expectancy analysis • strategy robustness • MARS System
Sources & Further Reading
- White, H. (2000). “A Reality Check for Data Snooping.” Econometrica, 68(5), 1097–1126. Link
- Sullivan, R., Timmermann, A., & White, H. (1999). “Data-Snooping, Technical Trading Rule Performance, and the Bootstrap.” Journal of Finance, 54(5), 1647–1691. Link
- Bailey, D. H., Borwein, J., López de Prado, M., & Zhu, Q. J. (2015). “The Probability of Backtest Overfitting.” Journal of Computational Finance. Link
- Bailey, D. H., & López de Prado, M. (2014). “The Deflated Sharpe Ratio: Correcting for Selection Bias, Backtest Overfitting, and Non-Normality.” Journal of Portfolio Management, 40(5), 94–107. Link
- Romano, J. P., & Wolf, M. (2005). “Stepwise Multiple Testing as Formalized Data Snooping.” Econometrica, 73(4), 1237–1282. Link
- Harvey, C. R., Liu, Y., & Zhu, H. (2016). “… and the Cross-Section of Expected Returns.” Review of Financial Studies, 29(1), 5–68. Link
MARS system documentation used for architecture-specific descriptions: MARS Master System Architecture & Operator Manual v2; Dynamic 7-Tier Monte Carlo Benchmark Operating Standard; MARS Structural Diagnostic Engine Framework & User Guide; Compliance Panel 3 Operator Manuals; Weekly Trading Scorecard v5.6c Instruction Manual; MAE/MFE Execution Efficiency Lab User Guide; and the MARS Branch Variant Selection Matrix.
Editorial originality note. This article was written as original material for the Quantitative Analysis → Overfitting Prevention category. The current Montex AlphaRail blog landing page was reviewed for positioning and taxonomy only; no language or article text from the page was reused.
Risk disclosure. Trading foreign exchange and leveraged instruments involves substantial risk. Simulations, backtests, and statistical validation do not guarantee future profitability. MARS is an analytics, governance, and education framework, not a guarantee of returns or individualized financial advice.